
Now let’s understand its use & importance in Machine Learning.

Hierarchical Clustering is one of the most powerful Unsupervised learning algorithms to represent the data in a tree-like structure & also find out similarities between the data.
Hierarchical Clustering is often associated with Heatmaps. Now, what are Heatmaps? Well, Heatmap is a visualization technique in Machine Learning which is often used by Data Scientists to see the similarity between any two given features of the dataset. Heatmap makes it easy to see a compressed summary of data and allows users to see and actually visualize the data, rather than just understand from numbers. Here is a simple example:-
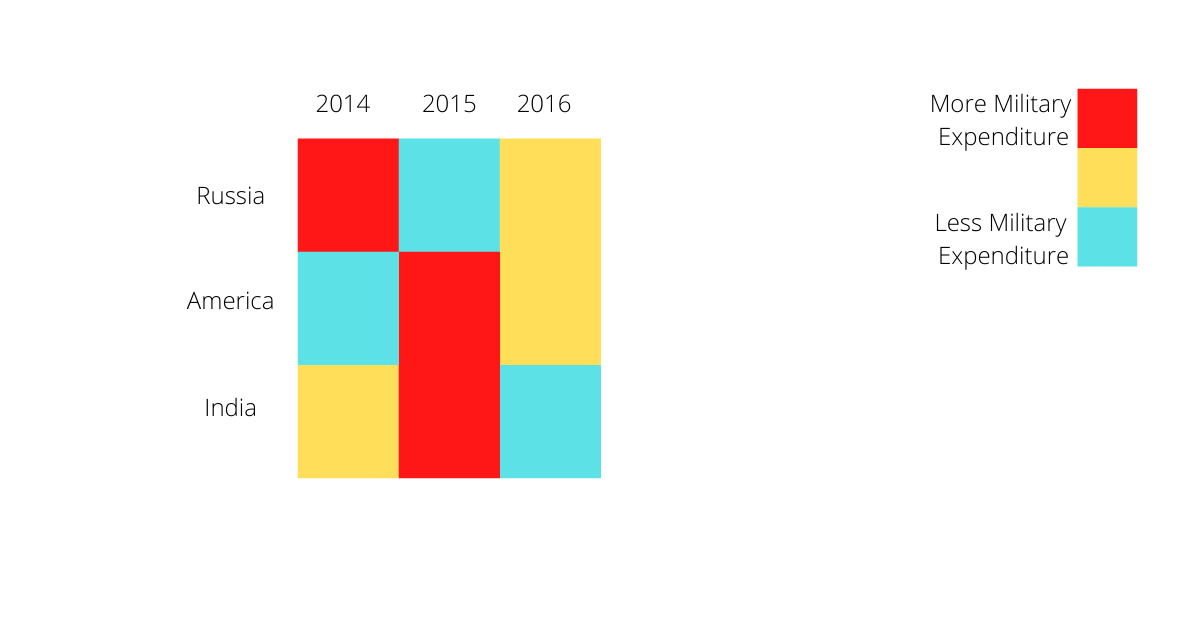
This Is A Simple Example Of The Amount Of Military Expenditure By Each Country Within A Span Of Three Years. By Heatmap Not Only Can We Understand The Dataset But Also We Can Gain Valuable Insights From Vast Datasets, Which Is Very Easy To Understand. Now Let’s Dive A Little Deeper Into Hierarchical Clustering.
Q.S0 What is the purpose of doing Hierarchical Clustering?
As we now know that Clustering makes a huge difference in how the data is presented. So in Hierarchical Clustering, the first step is to treat all data points differently, then we try to represent groups of points that are closest and merge these together in one cluster and continue this process until all the clusters are merged together. Let’s understand this with the help of a diagram.
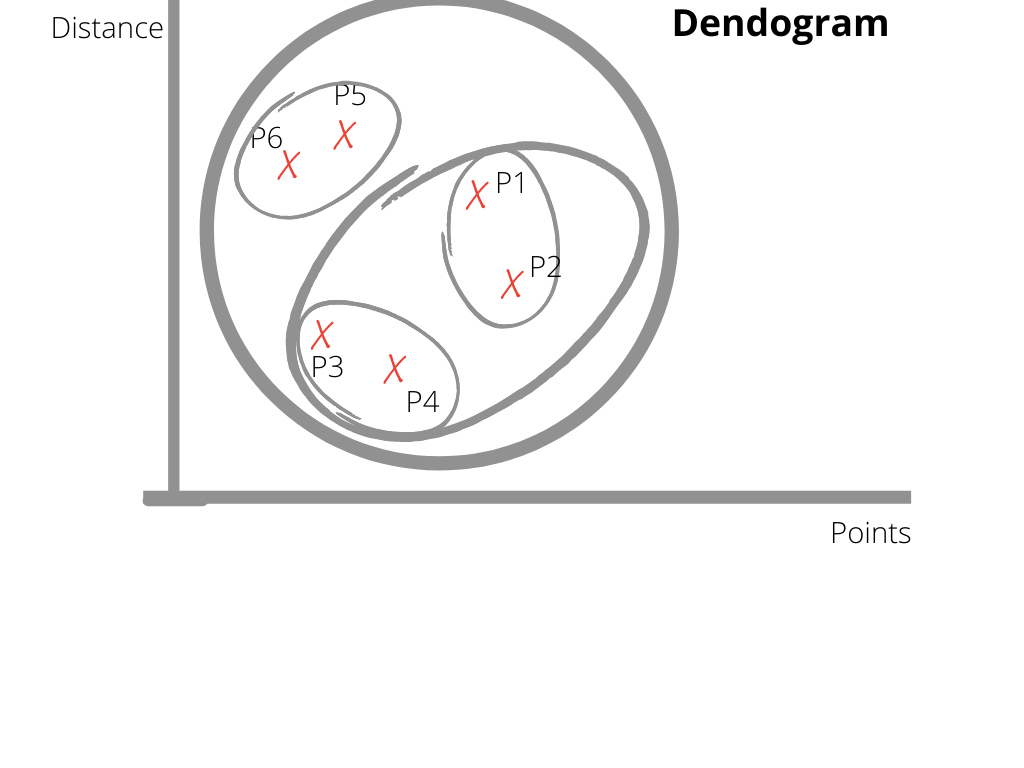
Consider the image given below:-
So as you can see in the image we have X-axis as Points and Y-axis as the distance between the points. The main output from the diagram is a Dendrogram This arrangement of points based on the similarity between their distances is known as a Dendrogram. So as you can see there are a total of 6 points here, and if you take a look at point P1 suppose, it is forming a cluster(group) with P2 as it is its nearest point. These clusters forming are computed based on the length of a straight line drawn from one cluster to another. The same goes for the other points as well. Now each cluster created will see which cluster is nearest to it and form another bigger cluster and we’ll get one big cluster combining these two clusters. Similarly, at the end of this process, we end up with a bigger cluster combining all of the clusters together, which in our case is the biggest circle in our diagram.
Our main aim in Hierarchical Clustering is to see how much clusters should be used in order to group the points. Basically, it works on the similarity of the data i.e we calculate the distance between the points & we calculate it using Euclidean Distance, which is given by
There are other forms of calculating distance metrics but the most common one is Euclidean Distance.
Now let’s take a look at the intuition behind this Clustering method:-
The intuition behind Hierarchical clustering can be well understood by this diagram which shows how clusters are created between the points which are nearest and then those points create clusters with another group of points which are nearest to them, and in the end, we get all of the points connected under one giant cluster.
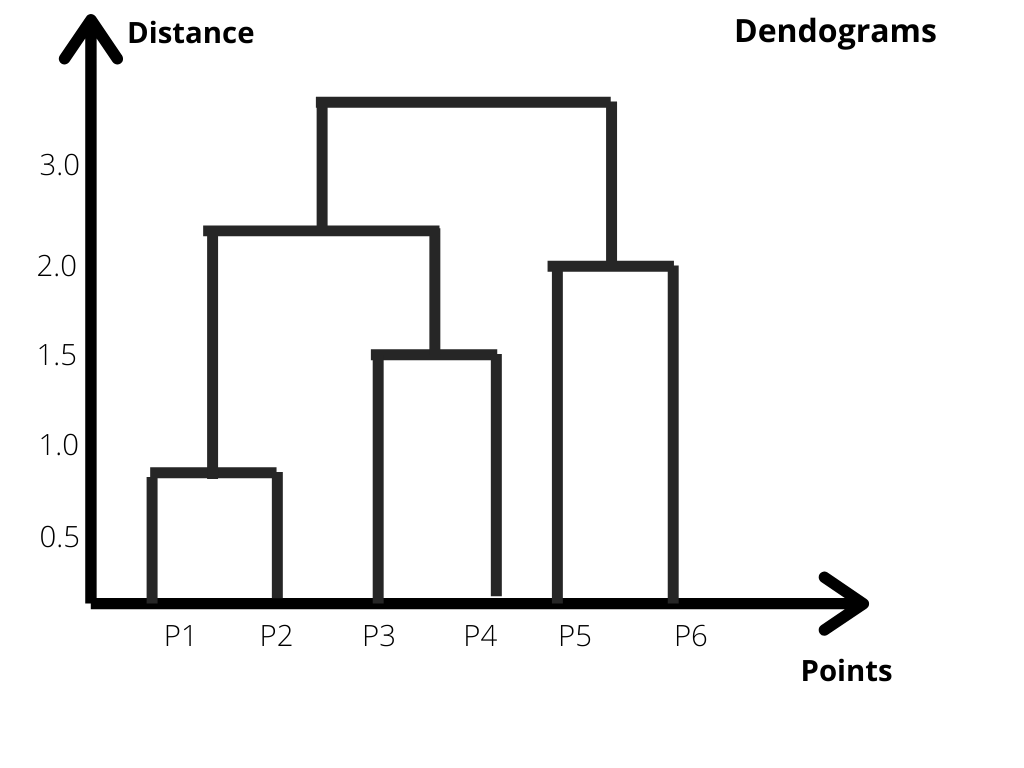
Through this diagram, we can easily visualize the steps of this clustering. Now basically the number of clusters will be equal to the number of vertical lines that are being intersected by the line using the threshold. Let’s understand this by a diagram given below:-
Here the number of vertical lines that are being intersected by the line drawn using the threshold will give us the number of clusters. In our example, as the red lines intersect 2 vertical lines, we will have 2 clusters and our clusters will have samples [P1, P2, P3, P4] in one group and [P5, P6] in the other. So this is how we decide a number of clusters using a Dendrogram in a Hierarchical Clustering

It is also important to know that Hierarchical Clustering is used only when an application needs to form a classification, They are also quite expensive and require large storage as well.
Okay enough theory, now lets code!
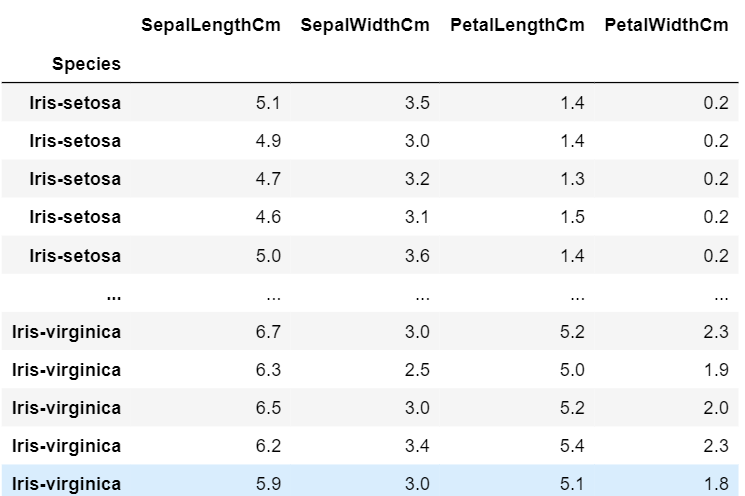
Now we will implement Hierarchical clustering with the help of Python. We will use the simple Iris Dataset for this purpose. The famous Iris Dataset contains four features (length & width of sepals & petals) of 50 samples of three species of Iris (Iris setosa, Iris virginica & Iris versicolor). You can download the Iris Dataset from this link:- Iris Data Set
Now let’s begin.
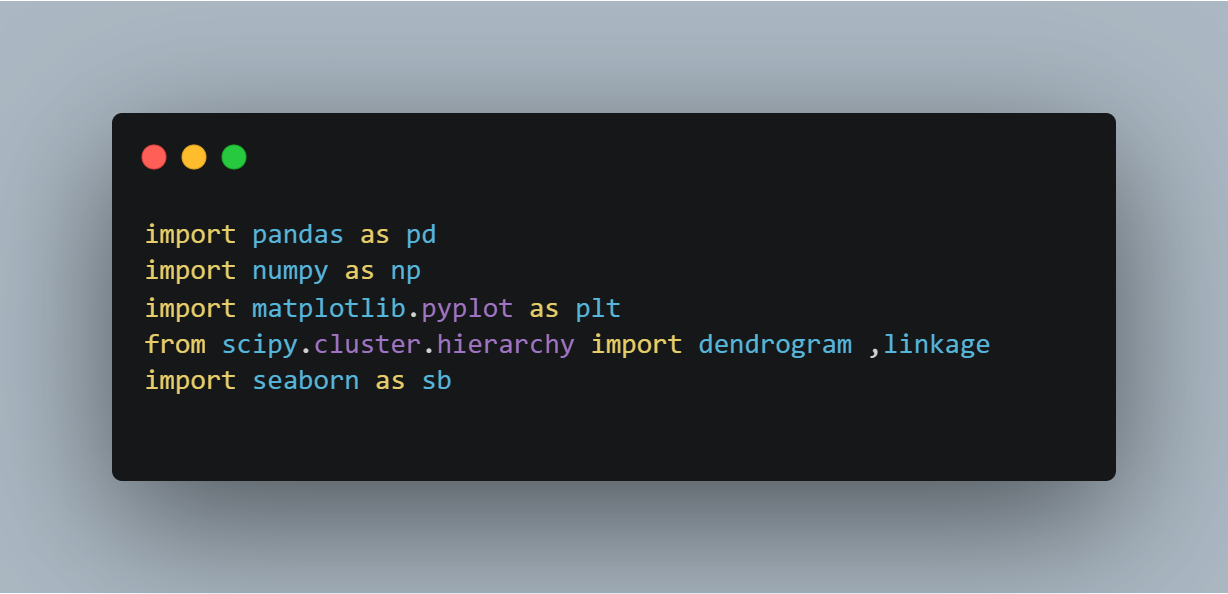
Step 1: First we will import the necessary libraries
Step 2: Now we will import the Iris dataset

Step 3: Here is what the dataset looks like:-
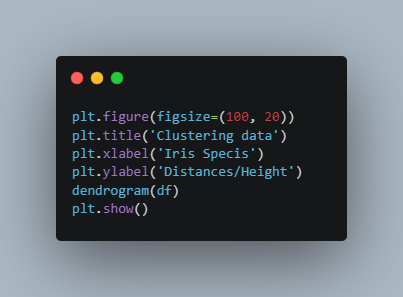
Step 4: Now let us write our final code to plot our Dendrogram:-
Step 5: Here is the Output. Zoom in to see the results
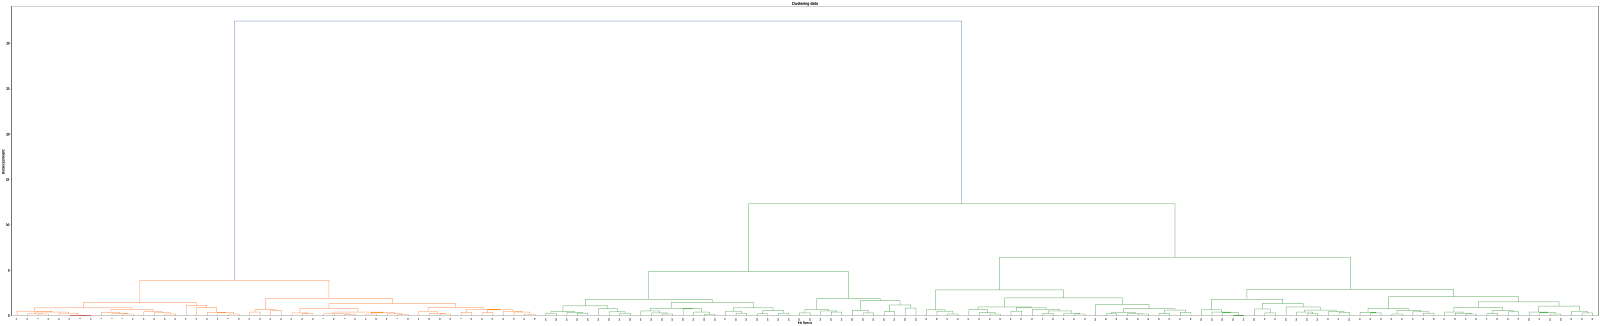
As we can see from the figure, Iris species are grouped from left to right based on their similarity with each other. Also, we can see that there is a hierarchical similarity between Virginia and Iris Versicolor