Data Science is the future of technology. But Data Science/ Machine Learning are no good without any representation. To understand anything whether its science or art, visualization is the key to understanding anything. Same reason is in data science, to understand data science we need to represent the data so that any person who is not related to the data science field can easily understand what a data scientist is trying to convey. To understand data science we use the library Matplotlib.
What is Matplotlib?
Matplotlib Library Is A Python Library Used For Plotting The Data. Matplotlib Provides An Object-Oriented API For Embedding Plots Into Applications Using GUI Toolkits. Developer Of Matplotlib Library Is Michael Droettboom And Written By John D. Hunter. Matplotlib Is Designed Such That It Resembles Closely To The MATLAB (Which Means Matrix Laboratory) Which At The Time Was The Most Popular Programming Language In Academia.
Matplotlib Offers A Hierarchy Of Objects Abstracting Elements Of A Plot. The Hierarchy Starts With The Top Level Figure Object That May Contain A Series Of Intermediate Level Objects And Axes-From Scatter, To Line, Marker.So In Matplotlib In Order To Produce A Plot On Screen, This Library Is Coupled With Some Of The Supported User Interface Backends Like TKInter, Qt, WxWidgets.
A Distinguishing Feature Of Matplotlib Is The Pyplot State Machine. This Feature Enables The User To Write Concise Procedural Code. In Python, Matplotlib.Pyplot Is A Collection Of Functions That Make Matplotlib Works Like MATLAB. Each Pyplot Function Makes Some Changes To A Figure E.G. Creates A Figure, Creates A Plotting Area In A Figure, Decorating The Plot With Labels, Etc.
In Practice, Using Matplotlib Without Pyplot Is Not The Best Option To Represent Our Data. Even The User’s Guide In Matplotlib Recommends Using Pyplot Only To Create Figures And Plots.
Why use Matplotlib in Data Science?
There are plenty of libraries in the market for data visualization other than matplotlib like Seaborn, ggplot, bokeh, geoplotlib, etc. But why use Matplotlib instead of this library? Seaborn library is a very powerful library which is used to create beautiful charts in a few lines of code. But the problem with Seaborn is that Seaborn is built on top of matplotlib to tweak Seaborn’s defaults. So having good knowledge in matplotlib will help the user to use Seaborn also.
The reason matplotlib.pyplot is so common and famous is because it was released when python was getting popularity among programmers which helped matplotlib gain popularity among big data lover programmers. Today there are many other libraries like plotly, ggplot, geoplotlib etc which are more powerful and user friendly than matplotlib, but using matplotlib helps you controls the tiniest of detail possible in a plot, like the canvas, graph objects/plots, axes, legends, etc. Most features which usually programmers use are present in the matplotlib you just have to name it.
Setup for Matplotlib in Python
In this blog I’m using Jupyter notebook through Anaconda application. In Jupyter Notebook syntax to install the matplotlib is

Importing the library in the program
Here I have created an object ‘plt’ for matplotlib.pyplot so that I don’t have to write matplotlib.pyplot everytime I use it.
Plotting a simple graph using matplotlib.pyplot
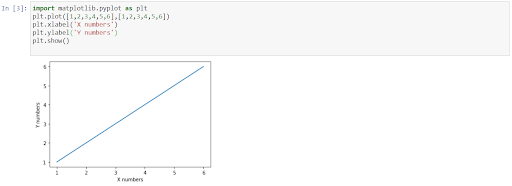
The above plot is a line plot as you can see that the following numbers are represented as a line.
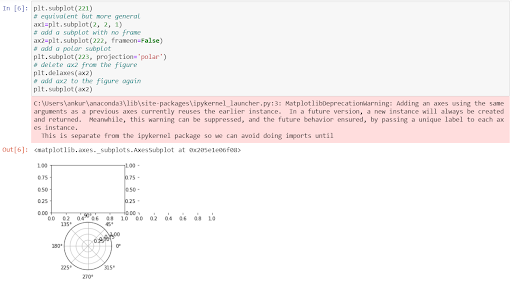
Below is shown how one can plot multiple graphs on a python window using matplotlib function called as subplot().
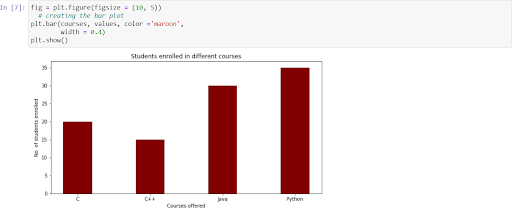
Bar charts are very common in business analysis as well as in data science/machine learning. Plotting a bar chart in matplotlib is by using the function called as bar().
In Machine learning one of the most important graph functions is scatter(). Scatter plot is used to represent the variables in the form of dots in the plot. Scatter plots help us to observe the change in one variable affects another variable.
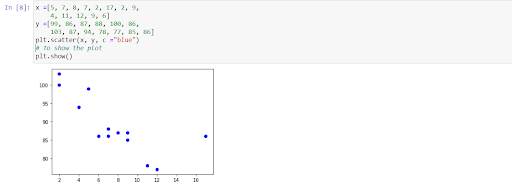
There are many other graphs like pie charts, polar graphs, histograms. Image can also be plotted using imshow() function. Matplotlib has many other functions in which representing the data is very easy where it is histogram or bar. For more please read the matplotlib formal website matplotlib.org. You will find everything on matplotlib on its website .
Conclusion
To conclude, matplotlib library is an excellent and reliable python library. It is best for any kind of data visualization and data exploration and publication quality plotting. Its user-friendly feature is one of the main reasons for its popularity among programmers and data scientists. Matplotlib is a base for data exploration. At the same time, its object-oriented interface allows to control all aspects of plotting for the advance visualization.
Because of its user-friendly feature and easy to start using matplotlib, it is almost universally taught as the first graphics library in universities and colleges. Because of its popularity and its heavy usage it’s safe to say it will be used in future also. Some say that matplotlib is old and outdated and it’s better to use a powerful library like Seaborn but the thing is Seaborn is an Add-On library which makes matplotlib even more better. To see more examples on matplotlib please visit matplotlib.org and stackoverflow to see what matplotlib is capable of.
Article by: ANKUR OMER
If you are Interested In Machine Learning You Can Check Machine Learning Internship Program
Also Check Other technical and Non Technical Internship Programs

