In this article, I will be discussing all the steps of the ML PLC or project Life Cycle sequentially with sample datasets. The main goal behind this article is to clear all the steps of ML PLC, discussed in my previous article. so, Here we perform a classification task on IRIS datasets to classify a flower into any of the three species namely “Setosa”, “Versicolor”, “Virginica”
thus, The different species of iris flower can be visualize as follows:

though, Based on the combination of petals and sepal’s width and length of an iris flower, different species of it are classified.
Let’s begin now
1. Business Objective/ Problem Statement
Here the problem statement is to predict the species of an iris flower. An iris flower has three different species: Setosa, Versicolor, Virginica.
2. Data Gathering
so, This is one of the famous datasets use in ML PLC and can be download from the Kaggle Platform. however, The link to download the dataset is mention below:
https://www.kaggle.com/uciml/iris?select=Iris.csv
Moreover, it is available with R and Python libraries
I will be using Jupyter Notebook as IDE and python language for further analysis and model building. The necessary libraries are import (Pandas, Numpy, Seaborn, Matplotlib).
Data set details

The dataset contains 150 rows and 6 columns (ID column will be eliminate).
Out of remaining 5 columns
Input variable/ Independent variables:
- SepalLengthCm
- SepalWidthCm
- PetalLengthCm
- PetalWidthCm
Output variable/ Dependent variables:
Species
3. Data Preprocessing
Now it’s time to clean the data. Let’s check out whether our data is in useable format or not
Missing values or null values: –

however, There is no missing value or NA values in the dataset. If any missing value exists in the
dataset we would also impute those values with various imputation techniques.
Checking for Improper data type
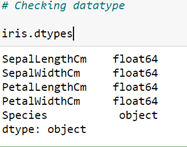
From the above table, it can be said that there are no improper datatypes and thus need to do datatype conversion
Duplicate Records

There are three duplicate records in total. Need to eliminate those records.
The iris dataset is cleaned and in a usable format and can be use for further analysis and model building.
Iris dataset very cleaned data set but in real life projects the dataset is never clean. We need to preprocess it and turn it into a usable format.
4. Exploratory Data Analysis
In this step, we try to generate insights about the data and make data ready for model building. Those insights can be helpful to understand the data better and help to make business decisions.
Data summary
The table in the following figure represents the overall statistical summary of all the features of the iris dataset. It shows Total no. of counts, mean value, standard-deviation value, minimum and maximum values, and different quantiles values (25%, 50% or median, 75%).

Visualization
Graphical representation of feature data so that the distribution of data can be known.
For Species Variable

For Sepal Length

For Petal Length

For Sepal Width

For Petal Width

Besides the above plots, there is n-number of plots that can be used for visualization. Different R and python libraries as well as other analytical tools facilitate the process to a large extent.
There are many EDA steps that need to be follow but as the Iris dataset is already a preprocess dataset by default, so here we are just ignoring those steps. To know what are the other steps please read my previous blog on ML PLC.
Data Partitioning
The dataset is divide up into two parts. One is training datasets use for training algorithms and another one is test datasets use for model evaluation.
Here the train to test split is complete by 70:30 ratio. Out of 147 total number of records,
In Training dataset = 102 records
In Test dataset = 45 records
5. Model Building
In this stage, model algorithms are trained with a training dataset. The algorithms understand the pattern inside data and build a generalized model. Those generalized models are able to memorize the pattern and give the predicted output whenever it is fed with new data.
Here for iris data, classification algorithms like Support Vector Machines, K-Nearest Neighbor, and Random Forest are used for building different models.
6. Model Evaluation
The test data is used for model evaluation. The accuracy score of each model is calculated to compare the performance of the model.
The following table represents the comparison of train and test accuracy among different models.

From the above comparison, it is found that the Support Vector Machine (SVM) has the highest accuracy for train and test data with a score of 100 % and 97.77% respectively. Though Random Forest has a training accuracy of 100% we won’t select the model because the accuracy score is less in the case of test data. So, SVM is considered the best model and can be used for deployment.
7. Deployment
The model selected above needs to be deployed as a service so that end users can gain the benefit and implement it in their applications. A model can be deployed to the in-house servers (using flask) or in cloud infrastructures (like Azure/AWS). Using the services fascinating user interfaces and visualization dashboard can be built up to attract client attention. Generating services and dashboards is quite a different and separate topic for discussion and I don’t want to limit the scope of it by discussing it at this moment.
So, I am concluding here.
Conclusion
In the above article, I discussed the Machine Learning Project Life Cycle or ML PLC taking an iris data set as an example. I hope I am able to explain all the stages in brief. For Code please visit the GitHub Repository by clicking on the link given below:
https://github.com/nabanitapaul1/ML_PLC_Iris-Dataset.git
written by: Nabanita Paul
Reviewed By: Krishna Heroor
If you are Interested In Machine Learning You Can Check Machine Learning Internship Program
Also Check Other Technical And Non Technical Internship Programs