
Introduction: K-Nearest Neighbour
The K-Nearest Neighbour method is used for both classification and regression problems. The method is based on learning by analogy. This means that the test samples are compared to the training samples that are similar to it. This is a non-parametric model so the output is independent of any parameters. For example, Linear Regression is a parametric model where the weights in the equation are parameters. The output is dependent on these weights or parameters.
Despite being a simple and non-parametric model, it gives results with high accuracy which are sometimes even better than complex models.
Let us discuss a draft of how this model works:
Working of KNN
- We fix a number ‘K’ which is nothing but the number of neighbors.
- Find K data points that are closest to this input data point.
- Now, we calculate the average of this data point from the K nearest data points individually.
- That calculated average is the prediction for the given data point
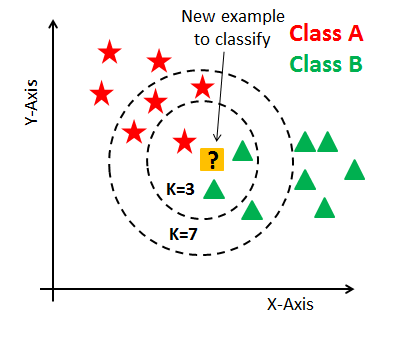
We can understand this more accurately from the image below.
Here we can see if we take K as 3, our data will be classified as class B and when K is 7, it will be classified as class A. This is because the maximum of its neighbors out of K belongs to that class respectively.
Predicting Nearest Neighbours
KNN captures all available data points and predicts new data based on distance measures based on similarity. This distance can be measured using various methods some of which are:
- Euclidean Distance
- Manhattan Distance
- Minkowski Distance
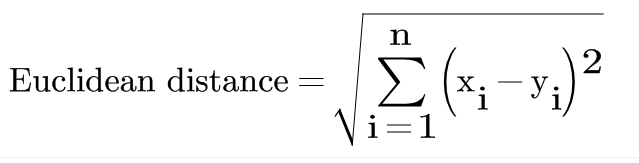
Euclidean Distance
Euclidean distance is a method to calculate the distance between two points in space. This formula gives the shortest path between the two points which is always a straight line. The formula for calculating distance by this method is:
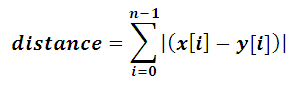
Manhattan Distance
This calculates the sum of all real distances between the two points. The name Manhattan is derived from a city in New York. It calculates by adding up absolute values of the difference of the coordinates
Minkowski Distance
It is a generalization of both Euclidean and Manhattan Distance. The formula for calculating this distance is given by:

Applications of KNN Algorithm
KNN algorithm can be used for both regression and classification problems. The classification problem can be binary or multivariate. It is easy to use and understand. KNN can be used in various other fields, for example:
- Pattern Recognition
- Finding missing values
- Classification and regression tasks
- Predicting document similarity
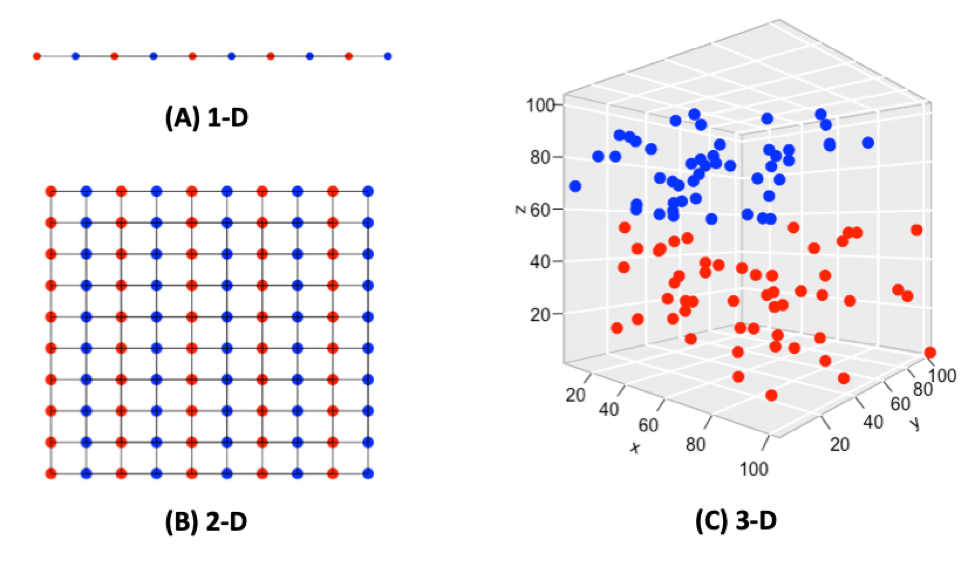
Curse of Dimensionality
KNN technique is not efficient on large datasets. This is because adding more features can increase the noise, eventually increasing the error. Sometimes there are chances of lack of enough observations to get better estimates. Using KNN in such circumstances can cause overfitting and much more time for a prediction.
(https://cofactorgenomics.com/wp-content/uploads/2019/04/picture1.png)
KNN is a distance-dependent approach. KNN deteriorates its predictive power with the increase in the number of variables required for prediction. High dimensional spaces are vast and points in the space tend to disperse from each other more as compared to low dimensional space.
Estimating K Factor
In K-Nearest Neighbour, it is very important to select the most appropriate value of K. These are some points that must be thought of while selecting the value of K.
- K=1 can be efficient but is more likely to be sensitive to noise.
- For large datasets, larger values of K give more accurate results.
- A larger K value gives smoother boundaries.
- Lesser values of K are more prone to overfit the data.
- Interesting relation for finding k for large sample data: K= sqrt(n)/2 where n is a number of examples.
- The value of K should be odd.
KNN Example
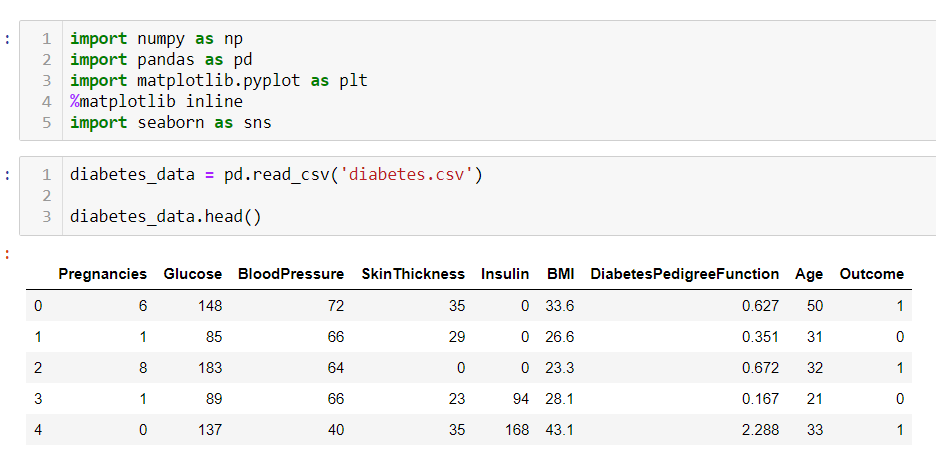
Let us apply K-Nearest Neighbour or KNN to the diabetes dataset. This dataset is available on Kaggle.
The first step is to import the required libraries. Then we have stored the data file in a variable.
We have used StandardScaler to scale the data. This subtracts the mean from the value and then scales it to unit variance.

Till here we have done scaling and stored the independent variables in ‘X’ and dependent variable in ‘y’. Now we have used the train test to test and divided the data in 1:2 for testing and training.
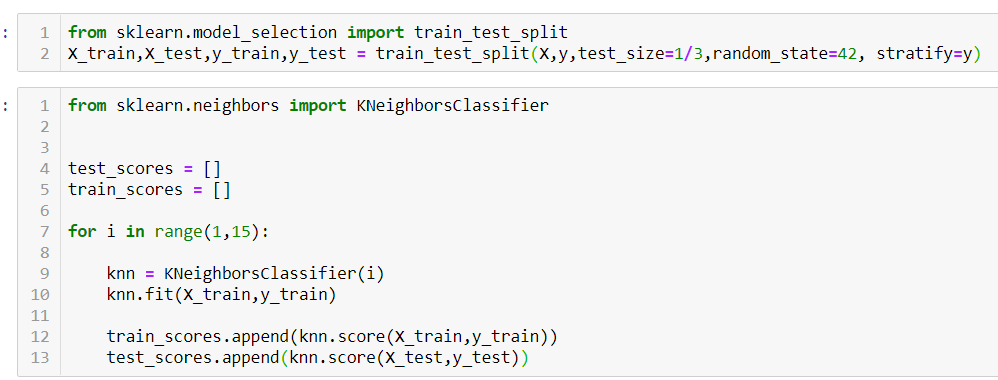
We are going to use the visualization method to find the best value of k. Here, we have plotted training and testing accuracy scores for various values of K.

We can see from the plot that the model best performs when K=11. as it is giving the highest accuracy. So we have selected K as 11 for the final prediction.
Pros and Cons of KNN
Pros:
- Simple and easy to implement
- It does not learn anything in the training period and is therefore often referred to as Lazy Learner.
- Can be used for both classification and regression
Cons:
- Computationally expensive for large datasets.
- Sensitive to the scale of the data and outliers.
- Does not work well with high dimensional data.
Written By: Chaitanya Virmani
Reviewed By: Krishna Heroor
If you are Interested In Machine Learning You Can Check Machine Learning Internship Program
Also Check Other Technical And Non Technical Internship Programs