
Origin of Linear Regression

(https://upload.wikimedia.org/wikipedia/commons/thumb/3/3a/Linear_regression.svg/1200px-Linear_regression.svg.png)
In statistics, the word regression has an ancient origin and a very particular meaning. Francis Galton, in 1889 was the geneticist who coined Linear Regression. He has shown how each feature of an individual is inherited by their offspring, but on average to a lesser extent.
For example, children with tall parents are also tall but the extent of height is not exactly the same. Galton depicted in a chart the average height of the parents and that of the children, noting what he called regression in the data.
Regression in Real World
In real-world applications, digital data is often encounter in a tabular format. The powerful mathematical tool, regression analysis, is use to analyze numerical data. Generally, regression analysis is a research process that best corresponds to a data point set that gives the best fit.
Eg: Estimating the population of a country based on the given data. This data may include the average population of a country in previous years based on birth rates and death rates and some other factors like immigration and emigration.
Types of Regression
Based on the form of the regression line, the regression analysis is divide up into two types:
- Linear regression
- Non-linear regression
The shape of the regression line depends on the distribution of the data. We can infer this from the image below. The first image shows linear regression whereas the second image shows non-linear regression.
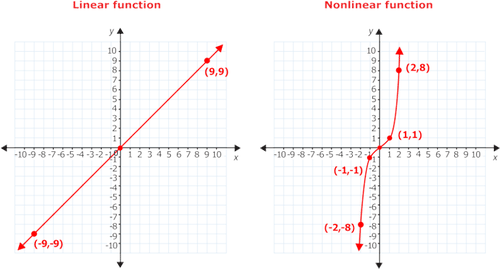
There are cases where a straight line is the regression line that best approximates the data, while in other cases, you need to fall into a curve to get the best approximation.
Linear Regression Types
Linear Regression is further divide up into two categories:
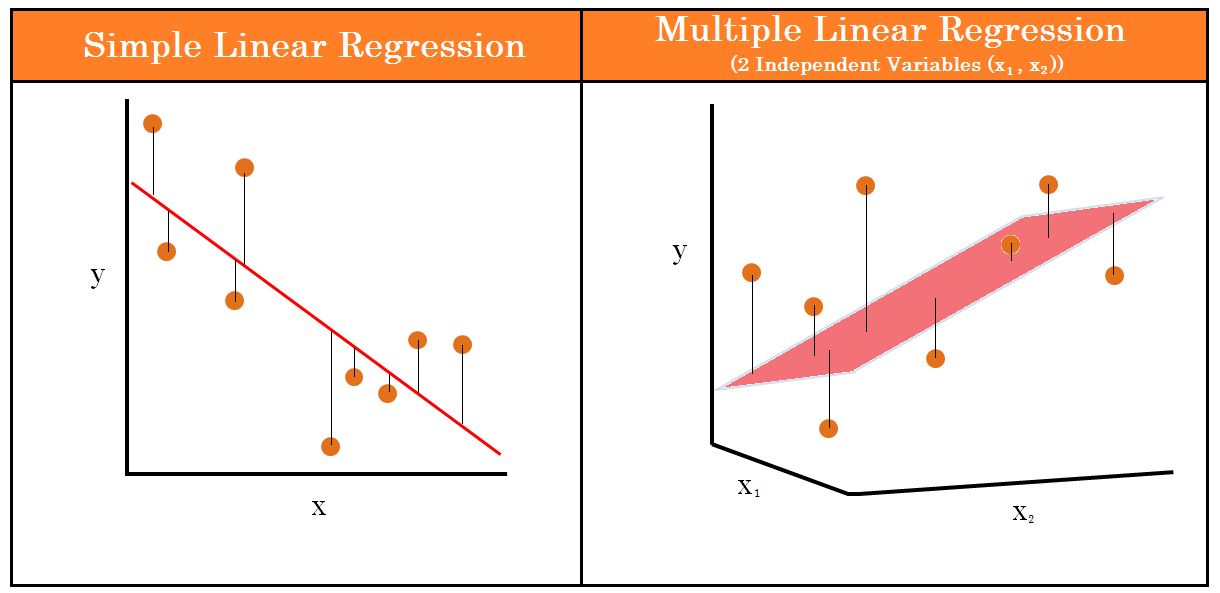
- Simple Linear Regression
- Multiple Linear Regression
The choice of the regression technique depends on the number of explanatory variables. In the case of linear regression, if there is only one input variable, then we will do simple linear regression. If instead, the input variables are two or more, we will need to perform multiple linear regression.
To summarize this we can say, a simple linear regression shows the relationship between a dependent variable Y and an independent variable X. A multiple regression model shows the relationship between a dependent variable Y and multiple independent variables X.
What if we have multiple response variables rather than explanatory variables?
In cases where we have multiple response variables rather than explanatory variables, we use multivariate regression. In this technique, a single regression model can estimate more than one response variable

The equation of the linear regression line with multiple explanatory variables can be reduce down to:
Y= W₁X + b₀
Whereas the equation of regression line with multiple response variables or we can say the equation of a multivariate regression line is given by:
Y= W₁X₁ + W₂X₂+….+b₀
Variance, Covariance, and correlation coefficient
Variance:
It is the expectation of the squared deviation of a random variable from its mean value. It represents a measure of the spread of data as a whole and is smaller when values are near the mean. In contrast, the variance is higher when values are distant from the mean. The formula of variance is:

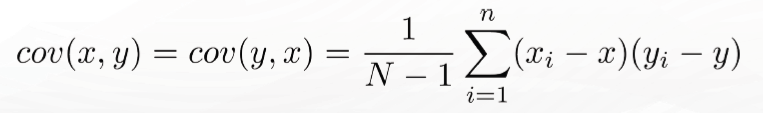
Covariance:
To measure the association between variable x and variable y we can use covariance. Covariance provides an unnormalize measure of their tendency to move together and is estimate by summing the product deviations from the mean for each variable in each period. Covariance is calculate as:
Correlation Coefficient:
The Intensity of the relationship between variables is difficult to understand based on covariance alone, as it is not consider as a standardized measure. Instead, the correlation coefficient represent as a standardized measurement of the relationship between two variables that can be calculated using covariance and standard deviations. The formula of this term is:

The range of the correlation coefficient lies between -1 and 1.
Values closer to 1 indicate a positive correlation and values closer to -1 indicates a negative correlation between the two variables x and y (independent and dependent variables). Values closer to 0 indicate no correlation between the coefficient. We can see in the image below what correlation actually means.

/TC_3126228-how-to-calculate-the-correlation-coefficient-5aabeb313de423003610ee40.png)
Linear Regression- OLS
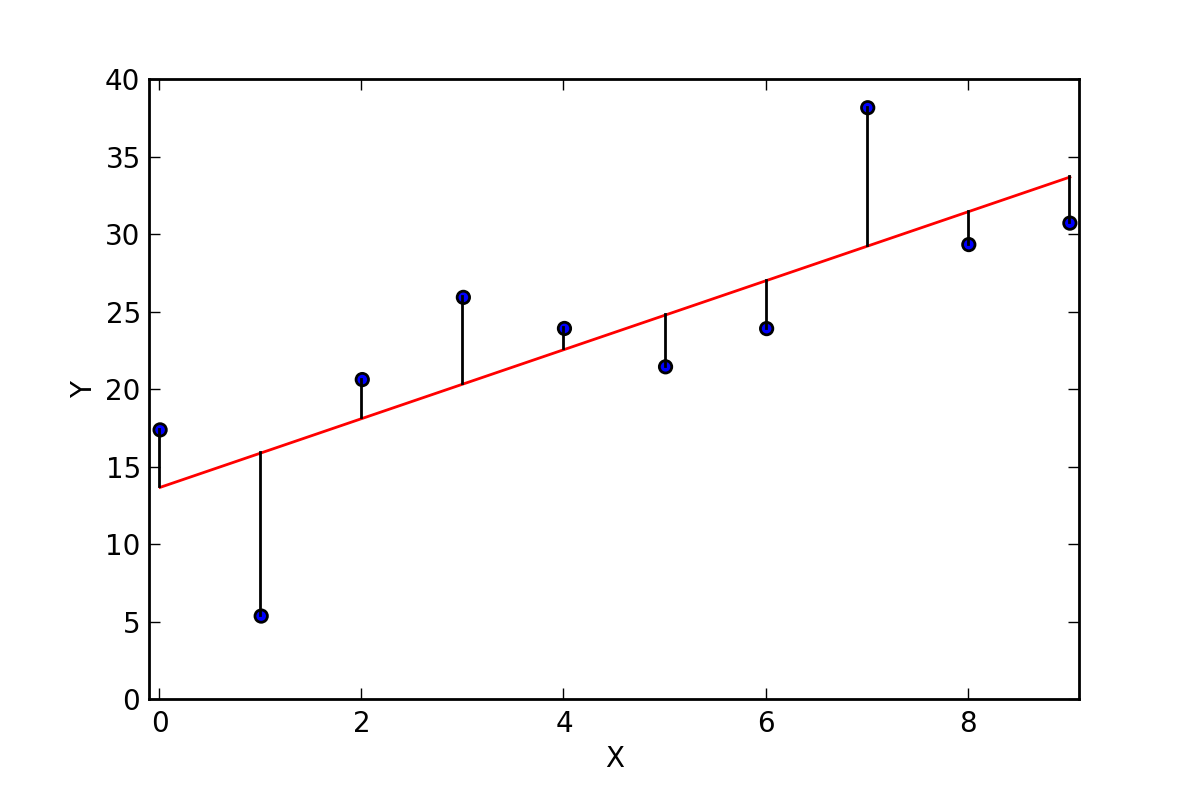
Figure-5(https://upload.wikimedia.org/wikipedia/commons/e/ed/Residuals_for_Linear_Regression_Fit.png)
The coefficients in the Least Square methods are estimate by determining the numerical values that minimize the sum of squared deviations between the observed value and the predicted value, as shown in the above figure.
R- Squared
R-squared, known as the coefficient of determination, is a method to determine a better fit. Model prediction of output data can be measured using R-squared and falls between zero and one. The model is better predicted using given data when the coefficient of determination is higher or closure to 1.

(https://ashutoshtripathicom.files.wordpress.com/2019/01/rsquarecanva2.png)
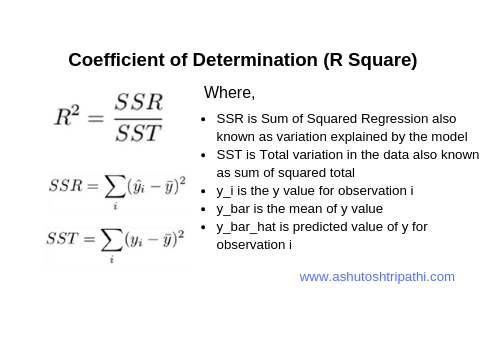
To calculate this coefficient, it is necessary to evaluate two quantities:
- SSR(Sum of squared Residual)
- SST(Sum of squared Regression)
Formulas for these two quantities are given in the above image.
Goodness of Fit
After constructing a regression model, it may be important to confirm the goodness of fit of the model and the statistical significance of the estimated parameters. R-squared is a commonly used check for the goodness of fit as it analyses the pattern of residuals and hypothesis testing.
Goodness-of-fit measures assess how well a model explains the variation in the outcome. They help to assess the quality of the model specification, for instance, to select among different model designs. They differ in how they evaluate the fit. Prominent goodness-of-fit measures include the (adjusted) R2) which is expected to be maximized and is based on least square estimation.
written by: Chaitanya Virmani
Reviewed By: Krishna Heroor
If you are Interested In Machine Learning You Can Check Machine Learning Internship Program
Also Check Other Technical And Non Technical Internship Programs