
Classification Metrics :
We will learn and understand metrics for classification tasks.
There are two possible output classes, In binary classification and there are more than two possible classes ,In multi-class classification.
Classification matrices help us to understand how good the model that we have trained using the dataset is so that we have confidence in the performance of the model for future predictions.
Some ways to measure Classification Metrics:
Confusion Matrix –
A tabular structure in four blocks reflecting the performance of the model.
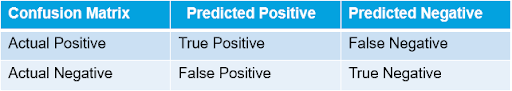

In this binary classification defaulter class is class of interest and labeled as +ve (positive – 1) class, other class is –ve (negative – 0)
True Positive : When actual y and predicted y both are 1 or positive.
False Positive : When the model predicts 1 but actually it is 0.
False Negative : When the model predicts 0 but actually it is 1 .
True Negative : Both actual and predicted are 0 .
Accuracy –
Lesser the false predictions, more the accuracy
How cleanly does the model classify the data points.
Overall correct predictions from all the classes to total number of cases. Should rely on this metrics only when all classes are equally represented. Not reliable if class representation is lopsided as algorithms are biased towards over represented class .
(TP+TN)/(TP+TN+FP+FN)
Depending on the classes the tabular matrix changes.
Sensitivity / Recall –
How many of the actual True data points are identified as True data points by the model .
Remember, False Negatives are those data points which should have been identified as True.
Recall = TP / (TP+FN)
Specificity –
How many actual Negative points are identified as negative by model.
Specificity = TN / (TN+FP)
Precision :
Among the points identified as positive by the model , How many are really positive.
Precision = TP / (TP + FP)
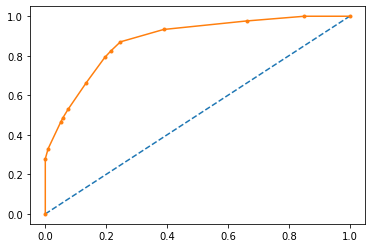
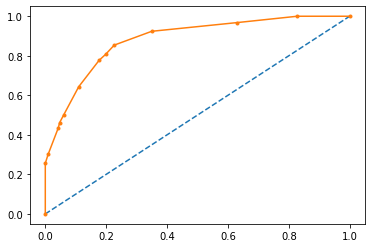
Receiver Operating Characteristics (ROC) Curve :
A technique for visualizing classifier performance
It is a graph between TP rate and FP rates
TP rate = TP / total positive
FP rate = FP / total negative
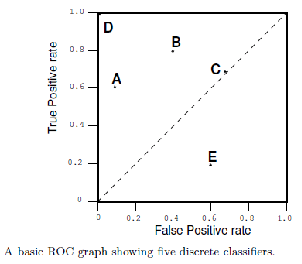
ROC graph is a trade off between benefits (TP) and costs (FP)
The point (0,1) represents perfect classified (e.g. D)
TP = 1 and FP = 0
Classifiers very close to Y axis and lower (nearer to x axis) are conservative models and strict in classifying positives (low TP rate)
Classifiers on top right are liberal in classifying positives hence higher TP rate and FP rate .
Now for better Understanding let’s take an example and evaluate the model using Classification metrics.

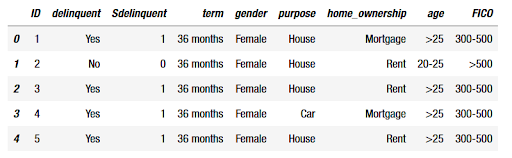
The main objective is to minimize the risk for which you need to build a model that will identify various risk and non-risk attributes of borrower’s to get into the delinquent stage.
Suppose we have the following Data set and we have finished building the model for the data set.
Now let’s try to evaluate it.
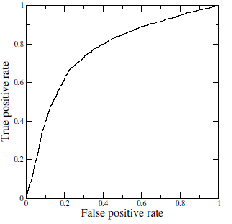
AUC and ROC curve for the training data
AUC and ROC curve for the testing data :
Confusion Matrix for the training data :
Array([[1985, 650],
[ 706, 4742]], dtype=int64)
Classification Report for training data :
precision recall f1-score support
0 0.74 0.75 0.75 2635
1 0.88 0.87 0.87 5448
accuracy 0.83 8083
macro avg 0.81 0.81 0.81 8083
weighted avg 0.83 0.83 0.83 8083
Confusion Matrix for the training data :
array([[ 922, 270],
[ 332, 1941]] ,dtype=int64]
Classification Report for testing data :
precision recall f1-score support
0 0.74 0.77 0.75 1192
1 0.88 0.85 0.87 2273
accuracy 0.83 3465
macro avg 0.81 0.81 0.81 3465
weighted avg 0.83 0.83 0.83 3465
Inference and Conclusion | Classification Metrics

Accuracy on the Training Data: 83%
Accuracy on the Test Data: 82%
AUC on the Training Data: 87.9%
AUC on the Test: 88.1%
Accuracy, AUC, Precision and Recall for test data is almost inline with training data.
This proves no overfitting or underfitting has happened, and overall the model is a good model for classification .
An important step while creating our model is evaluating our different models against each other. A bad choice of a classification metric could create a bad model.
So, always think of what you are predicting and how the choice of classification metric might affect your final predictions.
Most of the data science professionals and students still struggle to learn the basics of these metrics and its use, that is why I am pleased to present you a basic introduction of the topic . As you all know “The more that you read, the more things you will know “ so start your happy learning now.
Article By : Nikhil Rampuria
If you are Interested In Machine Learning You Can Check Machine Learning Internship Program
Also Check Other technical and Non Technical Internship Programs