

though Taking a FIFA 2020 dataset and analyzing the metrics of different players. We will also be using libraries such as pandas, matplotlib, and seaborn to perform exploratory Data Visualisation & analysis.
Numpy:
It stands for Numerical Python and is the core library for numerical and scientific computing. It consists of Single- dimensional Array and Multi-dimensional Array objects which is a collection of routines for processing those arrays.
Pandas:
It stands for Panel Data and is the core library for data manipulation and data Visualisation. It consists of single and multi-dimensional data structures for data manipulation. The single-dimensional is also known as a series object whereas a multi-dimensional object is known as a data frame. A data frame is a 2-dimensional labeled data structure and it comprises rows and columns.
Matplotlib:
so, It is a python library used for data visualization. You can create a bar plot, scattering, histogram, and many more.
Seaborn:
It is another python library used for data visualization which is built upon matplotlib. The main advantage of used seaborn is that it gives better visualization of data as compared to matplotlib.

Data Visualisation On FIFA 2020
Starting with the project, firstly you need to import libraries such as NumPy for data Visualisation & wrangling, Matplotlib for data visualization, and then load the data used pd.read_csv and store it in an object called fifa.

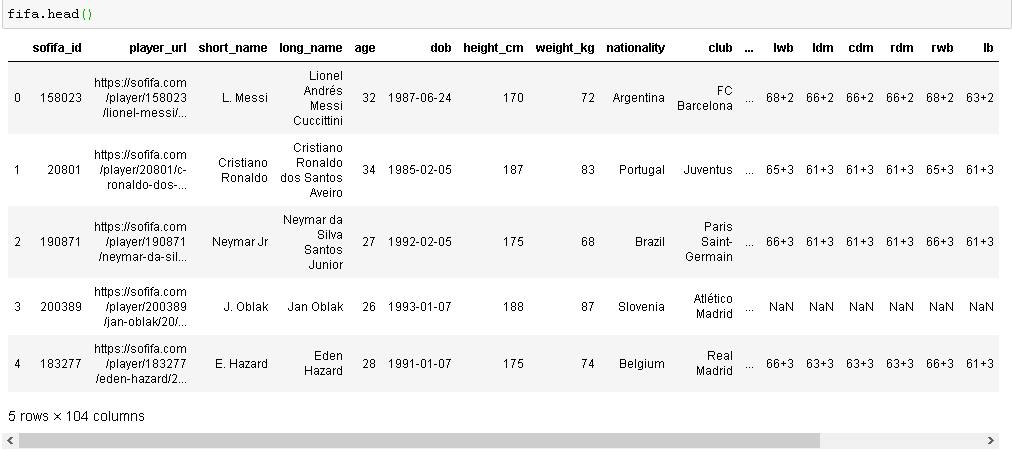
By typing fifa.head() function it shows the first five records of the dataset which give the glance of the entire rows and columns of the data frame.
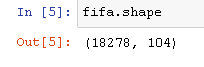
If you want to know how many records and how many columns represent in the dataset then you can type fifa. shape which shows that we have 18278 records and 104 columns.
To find out the majority of players belongs to which nationality type fifa[‘nationality’].values_counts() .
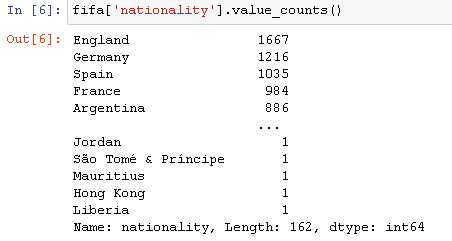
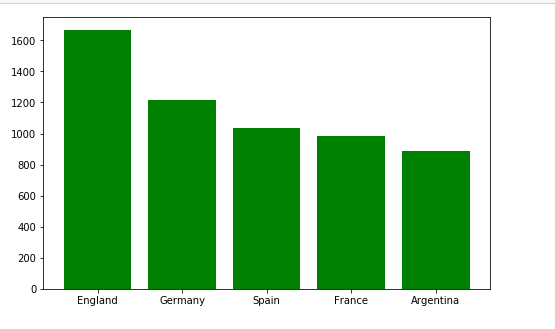
The above figure shows the frequency count in descending order which means the majority of the players belong to England and so on the count decreases with the least number of players belonging to other nations.
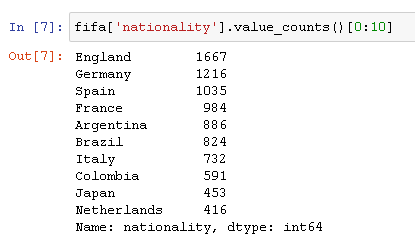
To see the top 10 majority players nationality run the below command.
Plotting the bar graph depicting the analysis of the top five nationalities to which the major players belong. Run the following command in your jupyter notebook.
| plt.figure(figsize=(8,5))plt.bar(list(fifa[‘nationality’].value_counts()[0:5].keys()),list(fifa[‘nationality’].value_counts()[0:5]),color=”g”)plt.show() |
Finding out which player gets the highest wages.
To see which player has a short name along with the highest salary/wages the . sort_values are used to sort the wages i.e. salary of the short name players in descending order.

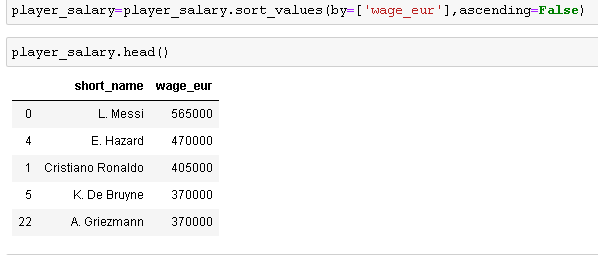
As you can see from the above data frame that L.Messi is the highest-paid player of 565000 euros.
according to the FIFA 2020 dataset then we have E.Hazard with 470000 euros who apparently get more than Cristiano Ronaldo. Then K.De Bruyne and A.Griezmann with the same wages of 37000 euros.
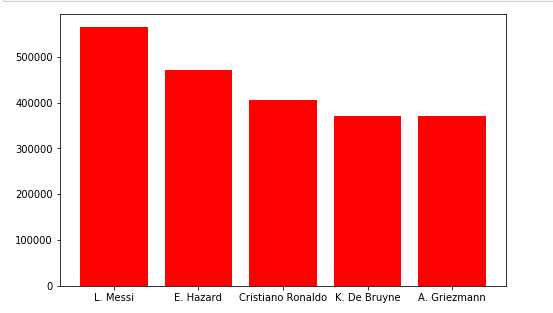
Plotting the bar plot from the above information by giving the figure size = (8,5) and passing the categorical values in a list i.e short_name and wage_eur with the color red.to display the plot write the command plot. show().
| plt.figure(figsize=(8,5))plt.bar(list(player_salary[‘short_name’])[0:5],list(player_salary[‘wage_eur’])[0:5],color=”r”)plt.show() |
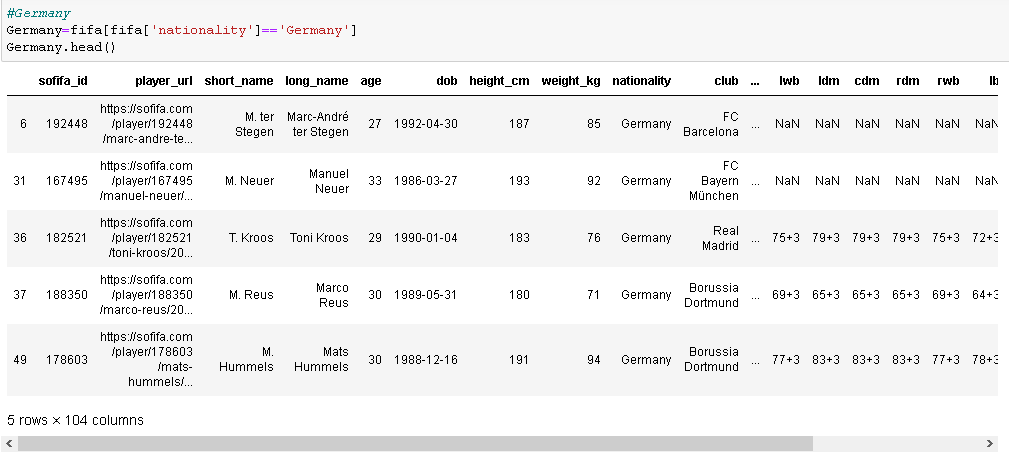
Analyze the players of one particular country and we have nationality columns from the database.
Let’s take the nationality germany.
Finding out who is the tallest german player or the player belongs to german nationality.
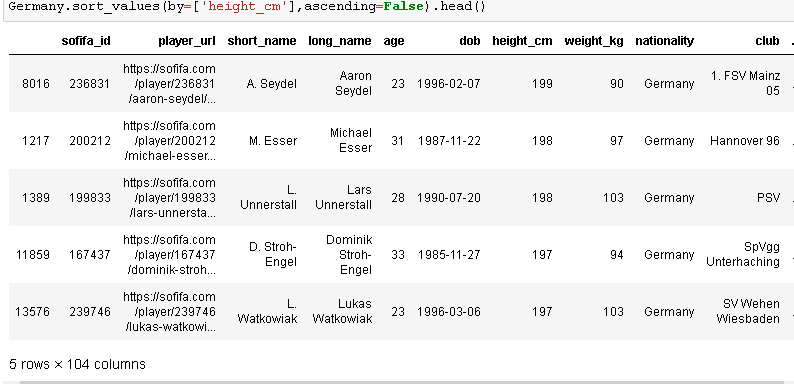
As we can see A. Seydel is the tallest german player with a height of 199 cm then there is M.Esser with 198 cm, L. Unnerstall with 198 cm, and so on.
Finding out the german player who has the highest weight.
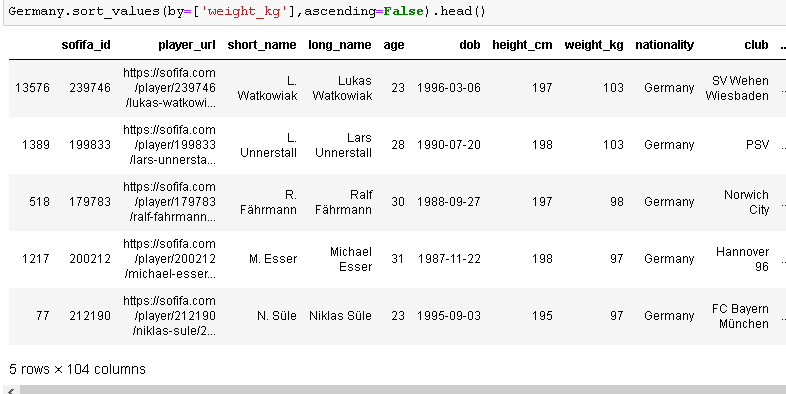
Germany.sort_values(by=[‘weight_kg’],ascending=False).head() with this, it gives the top 5 player weights in descending order. As we can see L.Watkowiak has the highest weight with 103 kg then L.unnerstall again with 103 kg and so on.
Finding out who are the top most earning german players.

We see Toni Kroos the highest-paid German player who plays for Real Madrid after that we have M.ter Stegen who plays for FC Barcelona.
Players Shooting and Defending Skills Analysis :
Extracting the short_name and shooting columns from the FIFA 2020 dataset and sorting the shooting rate of the player from highest to lowest
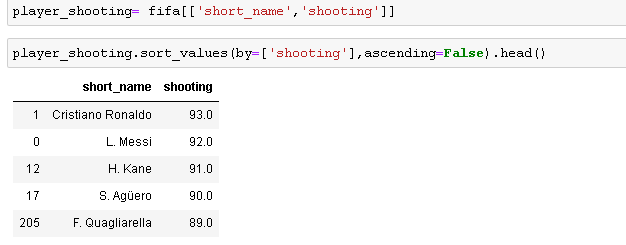
As we see that Cristiano Ronaldo has the highest shooting rate of 93.0 the L.Messi with 92.0.
For Analysis of the defending skill, extract the column short_name and defending form the dataset and then sort the defending rate of the player from highest to lowest.

In the above table, the G.Chiellini and V.vn Dijk has the highest defending rate with 90.
Conclusion:
By using the FIFA 2020 dataset data, I was able to explore and extract the data of the players concerning his nationality, wages, etc. Along with that, the different skills such as defending and shooting of the player are also sorted in the range of highest to lowest. With this Exploratory analysis and visualization, we get to know about the player’s nationalities, income, and skills which makes them the renowned players in the world.
written by: Kanchan Yadav
reviewed by: Rushikesh Lavate
If you are Interested In Machine Learning You Can Check Machine Learning Internship Program
Also Check Other Technical And Non Technical Internship Programs