Index
- What is meant by Data Scaling?
- Why is it important to scale data?
- Data Scaling Techniques
- Normalization
- Standardization
- Median and Quantiles
- Transformation Types
- Summary
Data Scaling
When a dataset is use for model training, it has many independent features and we analyze these features as the train model predicts the outcome based on these features. Feature Scaling/ Data Scaling is one of the most important steps during data preprocessing. As the name suggests, ‘Data Scaling’ is the process of transforming independent features so that the transformed data points fit on some defined scale, like 0-1 or 1-50.
Importance of Feature Scaling
Machine learning algorithms work on numeric values and thus tend to assume that the larger values have some sort of superiority over the smaller values, regardless of the unit of measurement. So, these ‘chief’ values start to play a relatively significant role while training the machine learning model.
Suppose, we have two features of ‘Age’ and ‘Marks’ for students’ records, as shown in the table below. The ‘Age’ cannot have a clear comparison with ‘Marks’. Since ‘Marks’ > ‘Age’ for this dataset, the machine learning algorithm assumes ‘Marks’ to be a more significant feature than ‘Age’.

So this more important feature tends to play a superior role in terms of the decision while training the model. Hence, feature scaling is necessary so that all the features are on the same level, without any preceding importance. Also, if ‘Age’ is converts to ‘months’ instead of ‘years’, then it becomes the dominant feature.
Another reason why feature scaling is important because it reduces the convergence time of some machine learning algorithms.
Data Scaling Techniques
Let’s look at different techniques that help in data scaling Techniques so that the transformed data fit in some specific scale.
Normalization
It is a very prominent data scaling technique. Normalization involves shifting and rescaling numeric values of features so that they end up ranging between 0 and 1. The rescaled value is calculate by the formula:
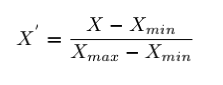
Since normalization involves minimum and maximum values of the feature, it is also known as Min-Max scaling. Normalization is mostly used when we know that the data does not follow a gaussian distribution.
Let’s look at different values of X’ depending upon the possibilities of X, from the formula:
- The value of X is equal to Xmin, in this case, the numerator will become 0, and hence X’ = 0.
- however, The value of X is equal to Xmax, it becomes the case of numerator = denominator and hence X’ = 1.
- so, The value of X is in between Xmin and Xmax, then the numerator is always less than the denominator and hence X’ lies between 0 and 1.
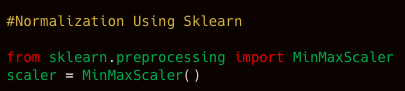
Normalization using Sklearn library:
Standardization:
Standardization is yet another scaling technique used for transforming values during data preprocessing. Unlike normalization, standardization does not have a bounding range. The mean of the rescaled attribute is equal to zero and the standard deviation is equal to one. The formula for standardized scaling is:

Standardization can be in use when the data follows Gaussian distribution. It is more robust for handling outliers as it does not rescale attributes in a fixed range. Thus, when the dataset contains outliers values, standardization is prefer over min-max normalization. Also, it facilitates the convergence of computational algorithms like gradient descent.
Standardization using Sklearn library:

Median and Quantiles:
Quantiles are defining points in the dataset, they differentiate parts of the data. A median divides the dataset into two halves and is therefore refer the middle quantile(2-quantiles).
- The quartile(quarter) divides the dataset into 4 parts and hence is 4-quantiles.
- The percentiles are the 100-quantiles(relative to 100).
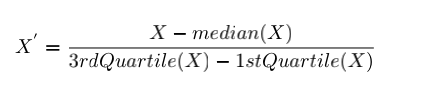
The method of median and quantiles for data scaling removes the median value of the feature and the resulting value is divided by the inter-quartile range(IQR). The inter-quartile range is the range between the 1st quartile(25th quantile) and the 3rd quartile(75th quantile). The median and IQR are then stores to be in use of future data.
This method, also refer as ‘Robust Scaling’, is of most use when data contains outliers and is prefer over standardization and normalization as it produces more robust estimates for the center and value range of the variable.
The formula for a transformed dataset is:
Robust scaling using Sklearn library:

Transformation Types
Data scaling is nothing but normalizing features to fit in a specific range. Let’s discuss different mathematical functions that transform data to achieve better normalization.
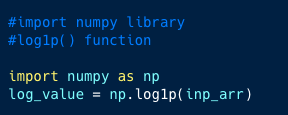
- Log Transformation: To achieve normalization for highly exponential values, we use log transformation. In this transformation, every value of x is replace by log(x) with a natural base, base 10, etc. We use the NumPy library for this function
- Square-Root Transformation: This is another kind of transformation function where every value of x is replaced by square-root(x). Negative values can be transformed after converting them into positive value by adding some constant.
- Reciprocal Transformation: The reciprocal transformation is used on non-zero values. Here, every value of x is replaced by (1/x).
Summary
Feature scaling and transformation are techniques that we should use during data preprocessing. A scaled dataset helps in building a strong model and thus, we as Data Science enthusiasts must be well informed about these scaling techniques.
Written By: Jagriti Prakash
Reviewed By: Rushikesh Lavate
If you are Interested In Machine Learning You Can Check Machine Learning Internship Program
Also Check Other Technical And Non Technical Internship Programs