
What is K-Nearest Neighbor?
K-Nearest Neighbor algorithm is one of many supervised machine learning algorithms. KNN has gained its popularity with its much simpler implementation and usage. Well, I used some terms like supervised machine learning. Do you know what it is? Well, in case you know kudos to that, and if you don’t, do not worry we will be unpacking it next.
Unpacking the stuff
To understand supervised machine learning let’s take an example. When you were a kid, your parents or your kindergarten teacher used to teach you the alphabet. You were asked to learn these alphabets and produce as it is without questioning why is ‘A’ like A at all.
Applying the same analogy to the computers we use today, computers are nothing but highly skilled kindergarten students. No matter how skilled they may be, they only perform according to the instructions that are given to them. They always need a supervisor to look after them which in this case is we ourselves.
Supervised Machine Learning
Supervised machine learning needs a supervisor that asks the machine to compute based on the input and output given. We provide the machine with the different parameters that we call features and along with that, we provide the results of that input.
Then you might ask what the role of the machine is then? Well, it is now where the role of the machine starts. The machine builds a model based on the input and output given and predicts the expected output when any particular input is given. Weather forecasting, the recommendation system are few examples that follow supervised learning principles.
What is the Classification algorithm?
You might have heard this term quite often. But do you know what role it plays in the context of machine learning? Well, let’s not consider the mathematical aspects of this algorithm rather let’s bring our example game into play.
Let’s say you and your friend are foodies. You two like to roam and travel for food and always enjoy a lot when it comes to eating delicious food. You and your friend have so much in common that it is hard to separate out your choices, but the only thing you two do not have in common is that you are among the lot who like McDonald’s but your friend doesn’t(I mean who doesn’t like McDonald’s!!). Now, this fact can very well be represented in the classification case.
Example on Classification
Classification comes in the case of choices. Here, you and your friend’s choices varied, you liked McDonald’s, and your friend doesn’t. These two choices can be represented in binary encoding. Let’s say 0 stands for not liking McDonald’s and 1 stand for liking McDonald’s. This idea can be extended to more than two persons, in fact, thousands of people can be represented in this manner as long as their choices fall in these two categories.

This table represents a sample group of people and their choices for liking or disliking McDonald’s. As stated earlier, 1 represents liking McDonald’s, and 0 represents disliking McDonald’s.
Although this might seem evident to work on the binary values of 0 and 1 but just hold on! In a most literal sense, the 0 and 1 represent the choice of liking or disliking. Let’s say we want to perform an addition on those numbers. Liking + disliking McDonald’s does that make sense? No right, so these values must be treated separately, one of the things that most people do is to perform one hot encoding which is beyond the scope of this blog.
K-Nearest Neighbor as a classification algorithm
KNN works on the principle of aggregation with commonality. Found too bookish right? Well, let’s see this in simpler terms. K-Nearest Neighbor is exactly based on this idea where we find commonality among the data points and try to assign them groups based on some properties.

Image source: https://upload.wikimedia.org/wikipedia/commons/e/e9/Map1NNReducedDataSet.png
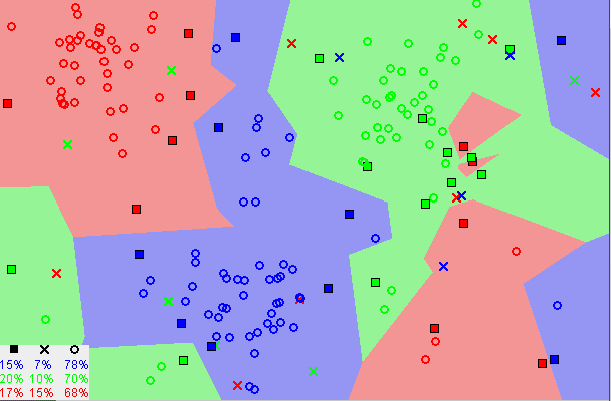
You can see in the image that there exist distinct boundaries of separation of similar data points that are close to each other or what we call neighbors. The number of neighbors that will be checked for a given point will be provided at the time of defining the model which we will see later in this section.
KNN uses Euclidean distance as a metric to calculate the nearest neighbors. In case the high school was far away in your mind, do not worry euclidean distance is not something tough. It is something we have used extensively to calculate distances between points and we will be using here in KNN also. The formula goes like this:
Euclidean Distance = sqrt( (x2 − x1)2 + (y2 − y1)2 + (z2 − z1)2 )
Breaking down the steps for implementation
Before starting make sure you split the dataset into training and testing datasets by giving a high percentage of values to the training data and a low percentage of values to the testing data.
Steps
- Import KNeighborsClassifier from the sklearn library and import matplotlib.pyplot library for plotting purposes.
- Define your model by specifying an arbitrary number of neighbors( we will tune it in a later stage)
- Make your model fit with the training datasets taking both the features and labels into account( Xtrain, Train)
- Predict the values using the predict function by taking the training dataset as the argument(Xtrain).
- Predict the values taking the test dataset as the argument.
- Calculate the accuracy of the training dataset.
- Calculate the accuracy of the testing dataset.
Checking the optimal number of neighbors(Hyperparameter tuning)
- Make two arrays for storing training accuracy and testing accuracy.
- Run a loop(say 20 times ) and use an iterator variable to iterate through the number of neighbors.
- Rewrite the same code for defining, fitting, and predicting the model.
- Store the training accuracies and testing accuracies by appending them to the respective arrays.
- Plot the graph for Accuracy vs Number of Neighbors.
- Based on the observations from the graph change the number of neighbors by observing at which neighbor the highest testing accuracy
and the minimal difference between the training and testing accuracy is obtain.
Python Implementation

Conclusions
The graph from the above lines of code depicts that the training accuracy(marked in red) decreases and simultaneously the testing accuracy(marked in blue) increases. Both the graphs nearly get saturate and we have not view any further increase in accuracy with the increase in the number of neighbors.
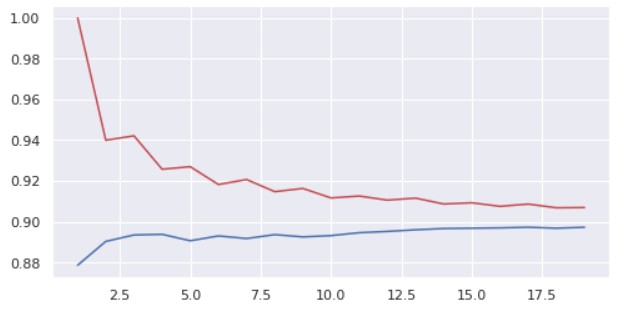
From the above graph, we can interpret that the distance between the test accuracy and train accuracy keeps on decreasing as we move from a lower number of neighbors to a higher number of neighbors but the test accuracy almost remains constant on the test dataset. Besides, implementing a higher number of neighbors requires more computational power. So from this, we can infer that although test accuracy almost remains constant, the training accuracy decreases, and optimal no of neighbors can be taken as 6.
Summary on K-Nearest Neighbor
However, We started by defining the K-nearest neighbor algorithm and we saw how it was one of the many supervised machine learning techniques available. We learn what is supervised learning and how classification is a part of it by taking real-life examples. Then we looked at the details of K-Nearest Neighbor works and followed it to our use. After implementing the algorithm we tried to find out the optimal number of neighbors by a technique known as hyperparameter tuning. Based on the results, we updated our number of neighbors.
Hope you had a wonderful time learning something new!
Written by: Swagat Sourav
Reviewed by: Vikas Bhardwaj
If you are Interested In Machine Learning You Can Check Machine Learning Internship Program
Also Check Other Technical And Non Technical Internship Programs