

As we know statistics is divided into two parts i.e., Descriptive Statistics and Inferential Statistics. Descriptive statistics involves the methods used for summarizing or organizing data like mean, standard deviation, variance etc. Inferential statistics refers to the methods used to explain the meaning of Descriptive Statistics. With the help of Statistical Test, we can do a critical analysis of how strong a relationship within the samples.
Hypothesis Testing | Statistical Test:
The hypothesis is a methodology which is mainly in use to prove or disprove the statement with the help of statistical analysis.
A goal of hypothesis testing is to analyse a sample in an attempt to distinguish between population characteristics that are likely to occur and population characteristics that are unlikely to occur. so, It is evidence to prove any statement.
however, There are two ways to prove Hypothesis testing that are;
- Critical Value Approach
- p-value Approach
I. Critical Value Approach:
A stepwise approach to proving the Hypothesis Testing using Critical Value approach:
- Formulate the Null Hypothesis(H0) and the Alternative hypothesis(H1 or Ha).
- thus, Select the appropriate test statistics.
- Choose the level of significance, confidence interval, and the Degree of freedom.
- Compute the calculated test value of the test statistics.
- also Compute the table test value of the test statistics.
- Compute the calculated values and table values.
- Make the statistical decision and also try to state the conclusion from it.
II. P-Value Approach:
In p-value test p terms as a probability.So, the probability of obtaining a p-value test statistic is at least as extreme as it was actually observe. Consider that the null hypothesis is true.
p-values represent the amount of evidence against the null hypotheses based on the available data. Smaller the p-value, stronger is the evidence against the null hypothesis and vice versa. The smallness of the p-value measures with respect to the significance level.
- If p-value < 0.05, reject null hypothesis H0
- If p-value >= 0.05, do not reject null hypothesis H0
Errors in Hypothesis Test decision making;
- Type I Error: It means when our null hypothesis is correct, still, we reject it. It’s considers it a serious type of error.
- Type II Error: It means when our null hypothesis is wrong, but still we accept it.
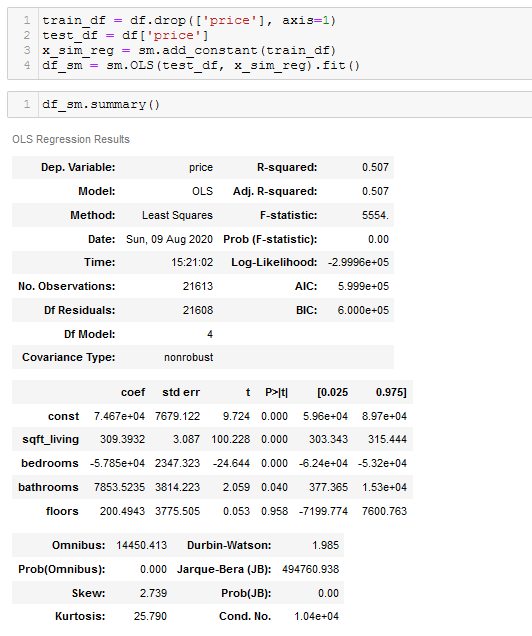
We can follow the long statistical approach to prove the Null hypothesis. But, for sort, we can use Python Scipy library, where we can call any test with a few lines of code.
Let’s see the summary of Scipy library for the House price prediction dataset.
It’s a regression problem.
Selection of Hypothesis Test | Statistical Test
As we know that Inferential statistics are divided into two types that are Parametric and Nonparametric.
A Hypothesis test is also divide up into two types i.e., Parametric and Nonparametric test.
1. Nonparametric Tests:
1.1 Wilcoxon-Sign Test: It is in use to compare two paired samples.
1.2 Friedman Test: It is used to compare more than two paired samples.
1.3 Mann-Whitney Test: It is In Use to compare two independent samples.
1.4 Kruskal -Wallis Test: to compare more than two independent samples.
1.5 Chi-Square Test: It is In Use to check the dependency of the variables and the variables should be categorical.
2. Parametric Tests:
2.1 One-Sample t-test: It is used to compare a sample mean with the population mean.
2.2 Two Sample paired t-test: to compare the mean of two paired samples.
2.3 Two Sample independent t-test: It is used to compare the mean of two independent samples.
2.4 One-Sample f-test: comes in use when the dependent variable is continuous and the independent variable is categorical. It is also an One-Way ANOVA. Here ANOVA refers to Analysis of Variance.
2.5 Two Sample f-test: It is In Use when a dependent variable is continuous and an independent variable is categorical in which there are 2 independent variables. It is also known as Two-Way ANOVA.

So, based on the nature of independent variables we can decide between ANOVA, ANCOVA and Regression.
written by: Sachin Yadav
reviewed by: Vikas Bhardwaj
If you are Interested In Machine Learning You Can Check Machine Learning Internship Program
Also Check Other Technical And Non Technical Internship Programs