
The topic I am going to discuss today is the foundation of data science: Business Moments. Without this parameter in statistics, the shape and the distribution of the data set cannot be understood, so it is very important for every professional who entered into the field of data must know this.
Everyone can guess what I am going to explain now.
These parameters summarize the bulk quantity of data and deliver relevant information to the data interpreter.
Those parameters are called “The Business Moments” because it helps to make Business decisions.
There are four Business Moments categories which are further subcategorized as shown in the following chart.

Fig: Different Business Moments
1st Business Moment: Measure of Central Tendency
This moment speaks about the center of the data point and indicates where the majority of data points lie.
a.) Mean:
The average of all the data points in a data set is called the mean. It can be calculated by adding together all the numbers in the dataset and then divided by the total number of values in the dataset.
Consider a data set having numbers like {1,4,5,7,8,9,10,11}
The mean will be (1+4+5+7+8+9+10+11)/ 8 = 6.875
The formula for calculating the mean in statistics is given below
For Population,
μ = (Σ Xi) / N
where ‘μ’ represents the population mean, Σ Xi represents the sum of all points in the population like x1, x2, x3, and so on, and ‘N’ represents the total number of points in the population. The mean in population is represented by the Greek letter.
For Sample,
x̅ = (Σ xi) / n
where ‘x̅’ represents the sample mean, Σ xi represents the sum of all points in the dataset like x1, x2, x3, and so on, and ‘n’ represents the total number of points in the sample dataset.
b. Median:
The middlemost value when the dataset is sorted in ascending order
Calculation of median,
Case 1: When the total number of data points, N is odd,
Consider a data set having numbers like {46,7,9,10 ,11}
After sorting in ascending order, {7,9,10,11,46}
The middlemost value here is 10 so the median will be 10
Case2: When the total number of data points, N is even,
Consider a data set having numbers like {46,7,9,10 ,11, 5}
After sorting in ascending order, {5, 7,9,10,11,46}
Median = (9+10)/2 = 9.5
Mean is affected by outliers but the median is not. If there is a huge difference between mean and median, it can be understood that the dataset contains outliers and need to treat the outliers for further analysis.
c. Mode:
The most repeated values in the dataset is called mode
Consider a dataset, {1,2,1,4,1,2,1,3,4,5}
“1” is repeated 4 times which is the highest number of repetitions here. So, the mode for the given dataset is 1.
Mean and median is useful for numerical data and mode is useful for categorical data.
2nd Business Moment: Measure of Dispersion
This moment describes the spread of data points around the mean. It speaks about how far
the data points are distributed away from the mean.
a. Variance:
It measures the difference between each data points from the mean
Variance can be represented by:
For the population,
σ2 = Σ (Xi – μ )2 / N
where ‘μ’ represents the population mean, Xi represents data points in the population like x1, x2, x3, and so on, and ‘N’ represents the total number of points in the population.
For sample,
s2 = Σ (xi – x̅)2 / (n – 1)
where ‘x̅’ represents the sample mean, xi represents the points in the sample like x1, x2, x3, and so on, and ‘n’ represents the total number of points in the sample.
Here the difference of data points and mean is square so that the positive and negative difference would not cancel each other and we would get the proper value not a reduce value for variance,
Consider a data set {1,7,8,10,17,6}
Mean = 8.2
Variance = {(1-8.2)2 + (7-8.2)2 + (8-8.2)2 + (10-8.2)2 + (17-8.2)2 + (6-8.2)2}/6
= (51.84+1.44+0.04+4.84+77.44+4.84)/6 = 23.4
b. Standard deviation:
Square root of the variance refer as standard deviation.
In Variance, units are also getting square so to bring to normal form need to calculate the square root of the variance to get the value in normal units, not in terms of a square. So standard deviation has come into existence.
Mathematically, expressed in the following form,
For the population,
σ = sqrt [ Σ (Xi – μ )2 / N]
where ‘μ’ represents the population mean, Xi represents data points in the population like x1, x2, x3, and so on, and ‘N’ represents the total number of points in the population.
For sample,
s = sqrt [ Σ (xi – x̅)2 / (n – 1)]
where ‘x̅’ represents the sample mean, xi represents the points in the sample like x1, x2, x3, and so on, and ‘n’ represents the total number of points in the sample.
c. Range:
The difference between the maximum and the minimum value of the dataset
Range = max value – min value
3rd Business Moment: Skewness
Skewness is the measure of asymmetry in a distribution curve from the normal distribution.
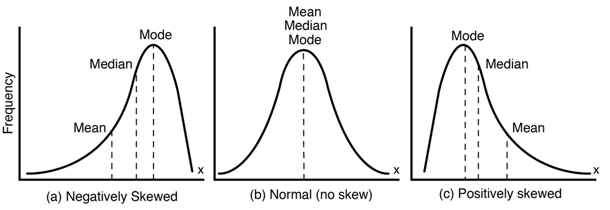
Fig: Different skewness and normal Curve (Image Source: Google Image)
In the figure above, (b) is representing a normal distribution curve without any skewness,(a) is a negatively skewed curve having the mass on the right side of the curve and a long tail extending in the left side, (c) is a positively skewed curve having the mass on the left side of the curve and a long tail extending towards the left side of the curve.
- Long tail indicates outliers in our dataset.
4th Business Moment: Kurtosis
Kurtosis is an estimation of the peak of the curve. It measures if the data is lightly or heavily tailed from the normal curve. A high kurtosis value indicates the presence of outliers.
Different types of kurtosis are shown in the following figure.
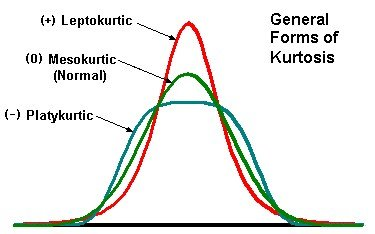
Mesokurtic represents the shape of our normal curve. In the Leptokurtic curve, kurtosis has a positive value, having a tall peak. In the Platykurtic curve, kurtosis is negative and has a broader and flat peak.
The skewness and the kurtosis deal with the shape of distribution so-called shape statistics.
Conclusion
In the above article, I have discussed four important business moments used in statistics to summarize the dataset. Thank you for reading. Please post your feedback and suggestions.
Written By: Nabanita Paul
Reviewed By: Krishna Heroor
If you are Interested In Machine Learning You Can Check Machine Learning Internship Program
Also Check Other Technical And Non Technical Internship Programs