In this article, we are going to assume you’re hired as a Data Scientist in an esteemed Company and you are specify to analyze some data. Here are the main steps you will go through Data Science Project: –
1. Look at the big picture.
2. Get the data.
3. Discover and visualize the info to gain insights.
4. Prepare the data for ML Algorithms.
5. Choose a Model and train it.
6. Fine-Tune your model.
7. Present your Solution.
8. Launch, Monitor, and Maintain your system.
In the above-mentioned steps, the main building blocks are from steps 1 to 4 as most of the data scientists spend their 70% time in these processes.
In the upcoming processes, we are going to see how to collect any dataset and create your own.
Working with Real Data | Data Science Project
When you are practicing in Machine Learning, real-world data is best to experiment with, rather than artificial datasets. Fortunately, there are thousands of open datasets to choose from, ranging across all sorts of domains. Below mentioned is the list of data source:
Popular open data repositories
- UC Irvine Machine Learning repository (https://archive.ics.uci.edu/ml/index.php)
- Kaggle Datasets (https://www.kaggle.com/datasets)
- Amazon’s AWS Datasets (https://registry.opendata.aws/)
Meta Portals (these are open data repositories)
- Data Portals (https://dataportals.org/)
- OpenDataMonitor (https://www.opendatamonitor.eu/)
- Quandl (https://www.quandl.com/)
Open pages which consist of Machine learning dataset
- Wikipedia’s list of Machine Learning Dataset (https://homl.info/9)
- Quora.com (https://homl.info/10)
- The Dataset subreddit (https://www.reddit.com/r/datasets/)
Framing the problem | Data Science Project
The first question to ask in Dataset or any workplace is to what exactly the business objective is. Building the Model is probably no end goal. How does your employer expect to use and get benefit from this model?
Knowing the objective is important because it will determine how you frame the problem, which algorithms you will use to evaluate your model, how much effort you will spend tweaking it.
Pipelining
When several Data Processing units are sequence together they form a data pipeline. The concept and use of pipelines is very common in ML systems since it complies with a lot of data manipulation and transformations simultaneously.
Components typically run asynchronously. So, each component extracts a large amount of data, then processes it, and splits out the resulting data into another data store. Then, sometime later the next component in the pipeline pulls the data and spits out its output. Each Component is fairly-contain The interface between components is simply the data store.
however, This makes the system simply grasp (with help of a data flow graph), and different teams can focus on different components. Moreover, if a component breaks down, the downstream components can often continue to run normally (at least for a while), by just using the last output from the broken component. This makes the architecture quite robust.
On the other hand, a broken component can go unnotice for some time if proper monitoring is not implement. The Data gets stale and the overall system’s performance.
Let’s Play with python and its tools | Data Science Project
From now on we will try to construct our own dataset of Electricity consumption from Jan 2019 to October 2020. So from start to end, we will use python and its libraries. These contain workspace (JupyterLab) pandas, NumPy, tabula, os, beautiful soup, and requests.
Creating the workspace
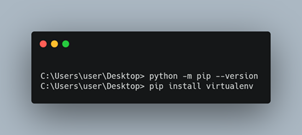
First of all, we need python installed if not then you can get it at https://www.python.org/. Now we have to create our workspace directory for code to work for that we will install virtualenv using pip. Working in an Isolate environment is highly appreciate so that you can work on different projects avoiding conflicting library versions. To Install and create a virtual environment we have to use the below commands as shown in the picture.
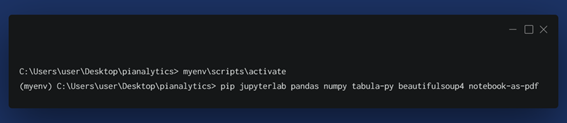
After the installation of the environment, we will activate our environment so that we can install further libraries such as jupyterlab, pandas, NumPy, tabula-py (requires Java Virtual Machine as its wrapper to the tabula in java), beautifulSoup4 (Web – Scraping Library) and notebook-as-pdf.
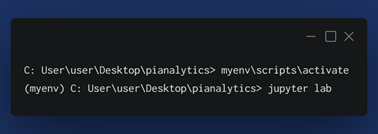
After the installation, we will run our JupyterLab after activating our virtual environment.

Till now, we have learned about how to create the environment for any project. To create the dataset we use web scraping.
Web Scraping
For Web Scraping, we are going to use BeautifulSoup and Request Library. The data will be pull from posoco. Power System Operation Control Limited is a wholly-owned Government of India enterprise under the Ministry of Power. It was earlier a wholly-own subsidiary of Power Grid Corporation of India Limited.
It was form in March 2009 to handle the power management functions of PGCIL. The data from which are collected is Jan 2019 to Oct 2020.
however, To extract the reports one should change the link of the page from 2018-2019, 2019-2020, and 2020-2021. Every Page has a different no. of length so one has to calculate the no. of pages to be extracted from the link array using Formula:
arr[Len(arr)-(No. of Reports+10):len(arr)-10]
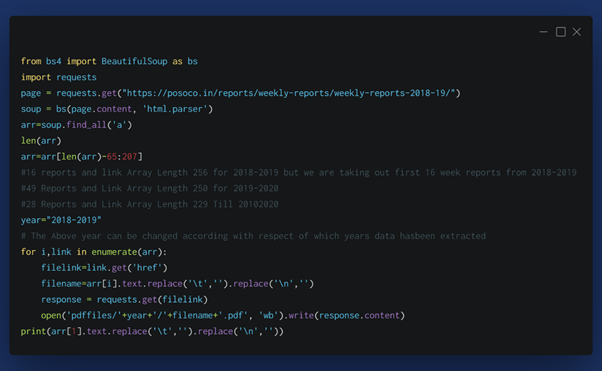
In the above code, in the for loop section we are trying to filelink from the link array and downloading that file in pdf format which is saved using a filename variable in a specific year folder.
Dataset Generation
In this portion, we will use python libraries to create the dataset from raw files. To create the dataset from pdf we will use tabula which is a simple python wrapper of tabula-ava, which reads the table from PDF.
Primary Dataset
The basic use of this function is to create data frames from pdf files then merge it with the preceding dataframe to create a dataset of the specified period such as 2018-2019, 2019-2020, and 2020-2021. We will create each dataframe separate so that we can merge them as one. We will add some information in it such as Region, Longitude, and Latitude. After Adding some data our basic dataset is complete for further addition which is Secondary DatasetGeneration.

The below code uses the Upper function to generate an individual dataframe for each 2018-2019, 2019-2020 and 2020-2021. Then the separate data frame is Merged into one main dataframe and saved as Electricity_data.csv. When the data frame is Generated then we’re adding the region column in the dataframe which are North region as NR, South Region as SR, West Region as WR, East Region as ER and North-Eastern Region As NER.

When the above code is executed it generates a primary data which can be converted in secondary data with more information.
Secondary Dataset
After the Further steps of the Primary Dataset, we will try to add some more data based on some given facts from the primary data such as Day, Type of Day(Working/Holiday),Month, Season, and Period i.e Pre-Covid-Lockdown/ Covid-Lockdown/Unlock-Lockdown. thus, Now a Vast Dataset is prepared with vast data to explore and we can perform different data analysis techniques in it.
The Code below basically reads the data frame and creates the Column array from the dataframe columns. We are also indexing the dataframe in below code.
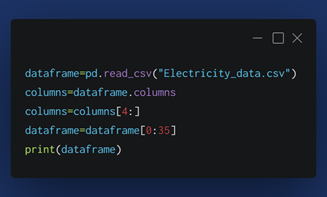

The above Code Represents how to Generate a row with a column data individually. Here we are representing row-column data in a dataframe. It’s like converting a 2-D matrix to a 1-D matrix. so, In the Second for loop we are formatting the dates by replacing the ‘-’ with ‘/’.
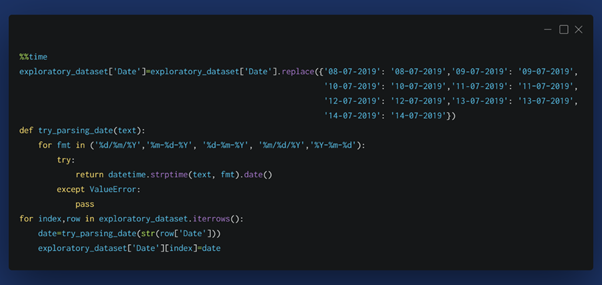
In the above code there is small trick, First we have executed the date parser function so that the dates in the dataframe are converted to particular format using datetime module and if there are some anomaly dates which are not converted then we have to check manually or writing small subroutine for those dates. When those are found we had to replace them manually using the replace function of pandas dataframe.
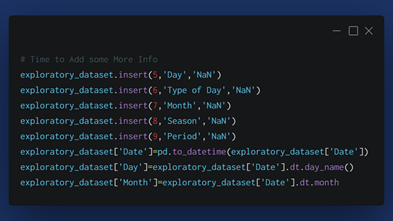
In the below code we are adding some more info to the data frame such as Day( day name), Type of Day (Holiday/ Working), Month (Numeric), Season (Winter/ Summer/ Monsoon/ Autumn). After Inserting we are filling up the column using some function from the particular library.

Now in this piece of code we are trying to add holidays and working days on some assumptions such as Saturday, Sunday and nationwide holiday under the category of Holiday and rest of the days as a working category . After all this we are sorting the data on the basis date using an inplace sorting algorithm known as Merge Sort. After sorting the data we are keeping the data from 01/01/2019 till 11/10/2020.
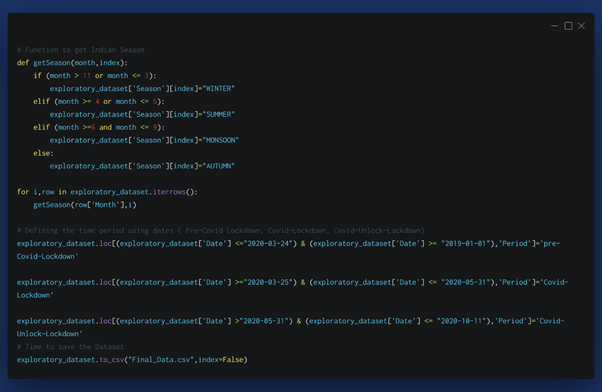
For filling up the season column we are parsing the dataframe through getseason() function and allocate the season according to the indian standards which are :
- Winter Months – 12,1,2,3
- Summer Months – 4,5
- Monsoon Months- 6,7,8,9
- Autumn Months – 10,11
After season allocation we are allocating the periods such as Pre-Covid-Lockdown, Covid-Lockdown and Covid-Unlock-Lockdown. Saving the data as Final_data.csv
conclusion | Data Science Project
From above discussions and code snapshots we have learnt how to create your datasets for the analysis. What is the importance of a dataset to be perfect for learning in any model?. We are going to use the above dataset in future for elaborating the data analysis part which is fruitful for data insights.
written by: Karan Gupta
reviewed by: Kothakota Viswanadh
If you are Interested In Machine Learning You Can Check Machine Learning Internship Program
Also Check Other Technical And Non Technical Internship Programs