

Exploratory Data Analysis is one of the most important and useful aspects of Machine Learning Operations. EDA is mostly used by Data Scientists to figure out the data and to get some insights from the data available.EDA basically helps you to analyze and visualize the data and get some necessary and useful insights from the data. After Data Cleaning and Preprocessing, Exploratory Data Analysis is one of the most useful methods for any machine learning model.
Data Analysis is usually the most fun and interesting part of any Machine learning problem where not only you get to understand the data through numbers but also visualize it through bar-plots and heatmaps. So let’s get started.
important task in Exploratory Data Analysis:
1) Helps to get an insight into the data.
2) Extract useful information.
3) Helps us to understand large datasets.
4)Understand Problem Statement more effectively.
5) Helps to create a base for our ML Model.
6) Detect outliers and a few anomalies.
The main role of EDA is basically to explore the data and to find out some hidden insights about the data.EDA also helps us to prepare our own datasets for analysis by filtering out the unnecessary components. There are a few steps in doing Exploratory analysis. Let’s check them out step by step with an example.
Now we’ll see the actual use of Data analysis in a real-life Titanic Dataset.

Note:- You can find the dataset in the given link:- https://www.kaggle.com/c/titanic/data
So let’s go through this process step by step.
So the first step would be to import the titanic dataset.
Step 1: Data Gathering
So after importing the necessary libraries, the first step would be to import the titanic dataset.

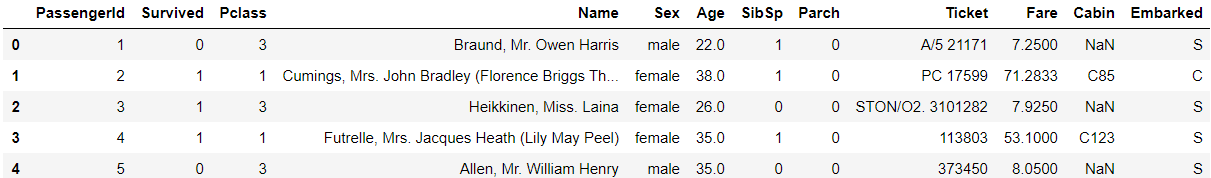
Now we’ll see what the dataset consists of, by simply printing out a few columns of the dataset.

So this is what the dataset comprises of:-
Step 2: Data Cleaning
Now after collecting our data, the most important part of all is to clean our data. Now data cleaning is very important so as to get rid of the missing values and filter out the irregularities to then proceed to the next step. Some of the problems we might find in our data are as follows:-
- We might find a few missing values.
- Wrong Format.
- Outliers.
Out of all above-mentioned irregularities, missing values and outliers are the most common.
a)Let’s check out for missing values:-

To check out the total number of values in our datasets we use the .info() method.

As we can see there are many columns in our dataset which have missing values.
So, we can deal with these missing values by replacing them with “NaN” or imputing them with mean or mode. And sometimes if the missing values are not important you can also choose to drop those values using the dropna() method.
Step 3: Statistical Analysis:-
In this step, we’ll check out some stats for our dataset. For eg:- check out the min, max and standard deviation for each respective column using the describe method.

Here is the output:-

This is a great way where you can get some numerical understanding of your data.
Step 4:- Data Visualization
Now Data Visualization is another important and fun step where you can see the visualization of your data and also see which features are correlated with each other. Now I won’t go into depth about this topic but I’ll show you a little glimpse of why it is useful. So first we’ll find correlations of the features with the help of Heatmap.
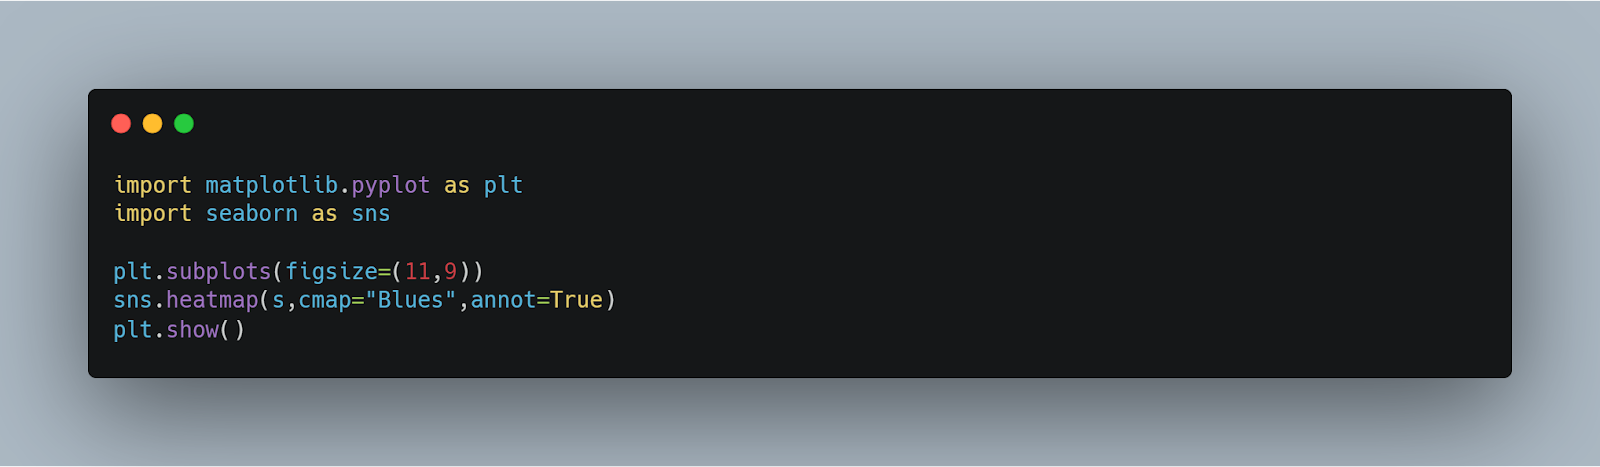
Here we first import the necessary libraries like Seaborn & MatplotLib and then use the heatmap to see the correlation between our feature variables.

As we can see from the figure we can easily find the correlation of the variables above. Also, we should always check out the correlation of the variables w.r.t the target variable which in this case would be Survived, Passengers. Try to figure out which columns and correlated to the Survival columns and so analysis on those columns to get better model accuracy.
Conclusion
So this is it, thanks for sticking around. So these were some few basic steps to follow if you want to do some Exploratory Data Analysis. The next step after this would be to train our data using Machine Learning Techniques.
Article By: Sanidhya Rajesh Barraptay
If you are Interested In Machine Learning You Can Check Machine Learning Internship Program
Also Check Other Technical And Non Technical Internship Programs