
Machine Learning is a part of Artificial Intelligence. In machine learning or in data science DATA plays a key role. Data might not be perfect all the time it may contain some errors or Null values. In some cases null values alone are given high priority because those too are a part of the collected data set and sometimes they might be useless in the dataset in some cases.
While working on a dataset for Machine Learning/Data Science project, Exploratory Data Analysis is the most important phase in the analysis of a dataset. If EDA is not done then it may affect the further Machine Learning model.

Firstly we are going to learn is….
- What is an Outlier?
- Are Outliers important?
- Why is it important to find an Outlier in the Dataset?
- How to identify an Outlier?
- What to do after finding Outliers??
What is an Outlier?
An Outlier is a point, which is quiet different with the remaining data i.e which is completely unrelated with the relation of the data. Outliers can also be formed during the collection of data for projects.
From this example we can understand What is an Outlier is…
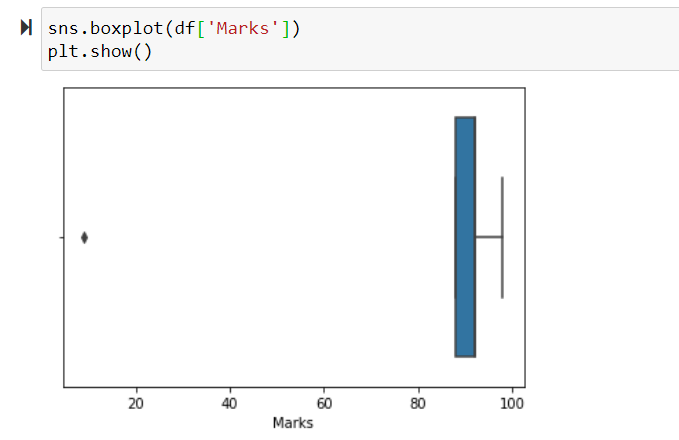
Here, in this example we are considering a subject mark of five students
| Name | Marks |
| Harsha | 98 |
| Karthika | 92 |
| Sai | 9 |
| Bhargavi | 88 |
| Tejovi | 92 |
Here, Sai’s marks are completely distant from the other’s marks. All the students are having nearest values but whereas for Sai gor 9 marks which quiet distant. This can be represented visually.…

Are Outliers Important?
Outlier is important in a dataset in some cases and useless in some other cases. When we find only one outlier in the dataset then we can remove it, when we find more number of Outliers in the data then we will keep them without removing. As we know every point in the data is important for analysis, so we can remove or we can manage. Mostly managing outliers is preferable than removing because that specific outlier may be a key point for the analysis.
Let me show you another example which contains number of outliers.
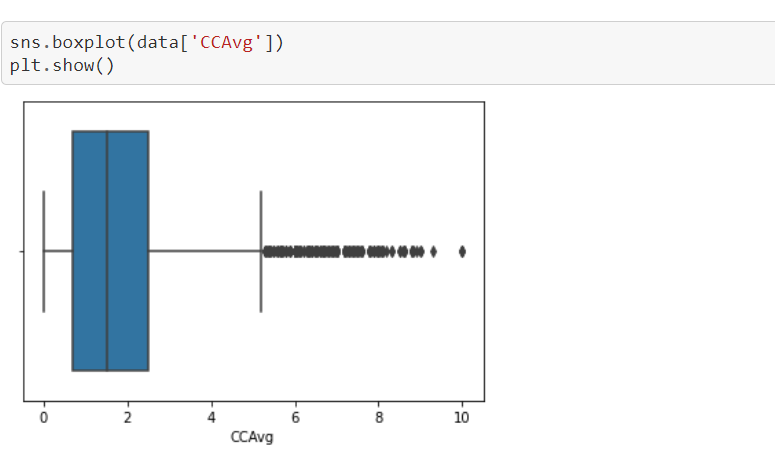
From the above example you can observe that we have more number of outliers. So in this case we are not removing those outliers inplace of removing we are going to manage them.
Box plot helps to identify the outliers which dipicts the outliers pictorially. To know whether the outlier is there or not, we use boxplot.
Outliers are very important in the dataset. Removing outliers in all cases is not a good practise. Managing outliers may not affect the further Machine Learning/Data Science model.
Is it important to find an outlier in the dataset?
Yes, It is important to find outliers in the data because outliers are also a part in the dataset. they are nothing but those may be null values or invalid entries or an observation which is distant to their fellow observations. So treating outliers is one of the main part in the Data Analysis and Manipulation phase.
Outliers may change the further ML/Statistical model. If dataset have more outliers in the data, then definitely they have impact on the ML/Statistical model. Treating Outliers makes the further ML/Statistical model more finite. So finding the outliers in the data is important. Here in below case, All bottles are looking same except one bottle which differs from others.

So Here Yellow bottle is the Outlier from the above case set.
Checking Null Values in a dataset..
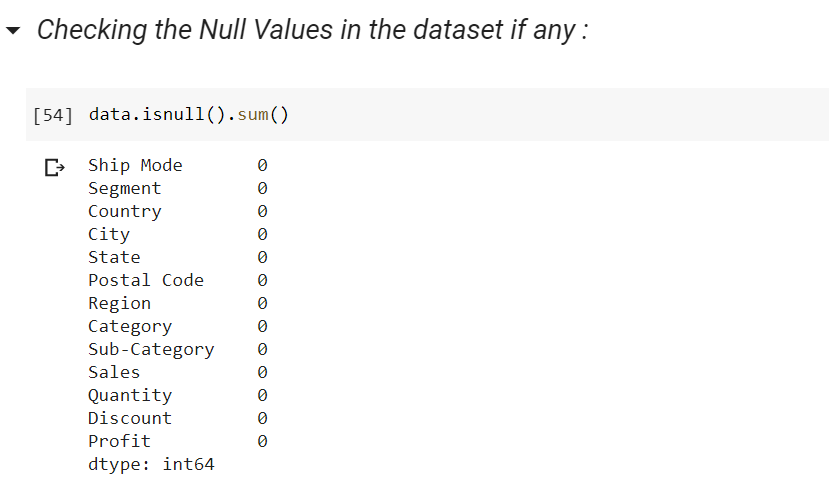
Here in this dataset, data does not contain any null values. Null values can also be outliers in a dataset.
How to identify an Outlier?
There are two types of analysis inorder to find the Outliers in a dataset.
- UniVariate Analysis
- MultiVariate Analysis
UNIVARIATE ANALYSIS :
Univariate analysis means one variable Outlier analysis. It is the easiest form of analysing the data.
MULTIVARIATE ANALYSIS :
MultiVariate Analysis means Two or more than two Outlier analysis.
Finding Outliers Using Visualisation tools
Box Plot :
In a dataset, if there is an outlier that outlier will be plotted as a point in the box plot whereas the other values are represented in the box.
For box plot analysis, we have to use a library named seaborn. We have to import seaborn library into the notebook.

Here is an example of how a boxplot and an outlier in a boxplot looks like..
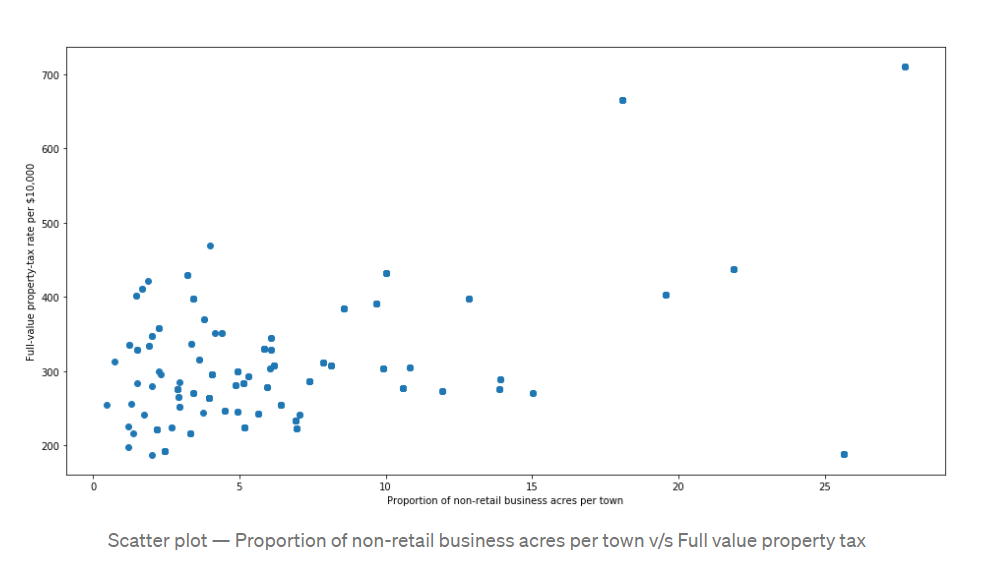
Scatter Plot :
Scatter plot means it shows the values of two variables. The points are plotted from left side to right side. It looks like a graph sheet as it contains X-axis and Y-axis.
For Scatter plot we use library named matplotlib.
Discovering Outliers with Mathematical Functions :
Z-Score Analysis :
Using Z-Score analysis we can find outliers. Here I’am considering a Bank Loan dataset. Now I’am applying Z-Score analysis to that data and you can see the output below..
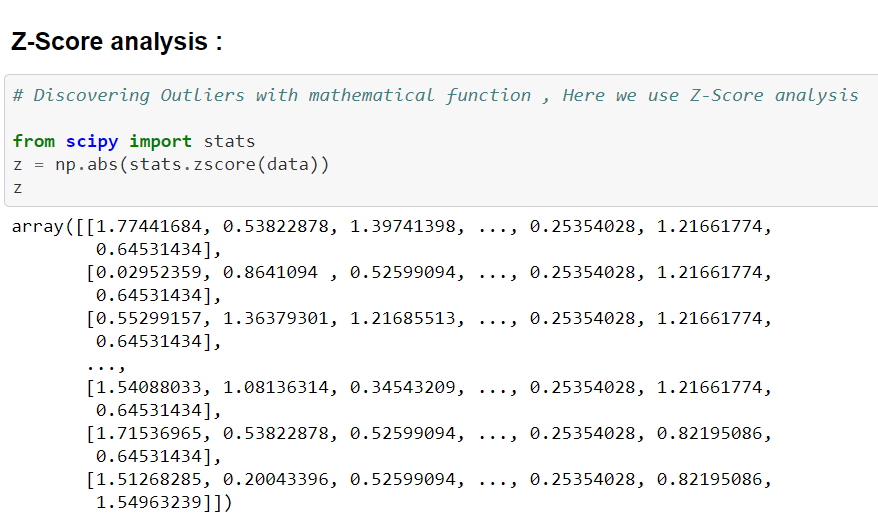
From the above data, it is very difficult to find where and what is an outlier. So to make it easier we will define a threshold to a value inorder to find and identify the outlier in the data. You can get a clear idea by viewing the picture below.
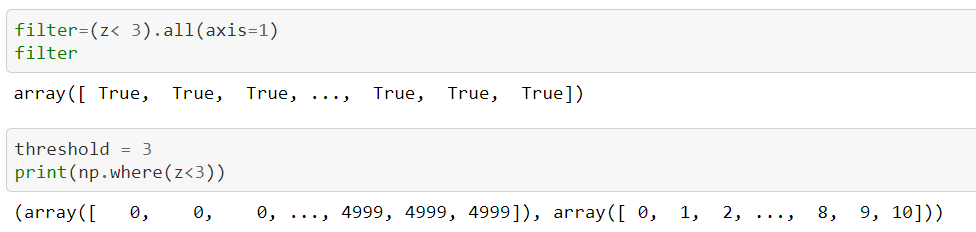
Here in this dataset all values are less Z-Scores than 3. Don’t get confused here, the first array is the list of the rows and the second array is the list of column values/numbers. Like example..,
==> print(z[0][0])
This gives the values of that element of address i.e first zero in the above code denotes the first element in the first array and second zero denotes the first element in the second array.
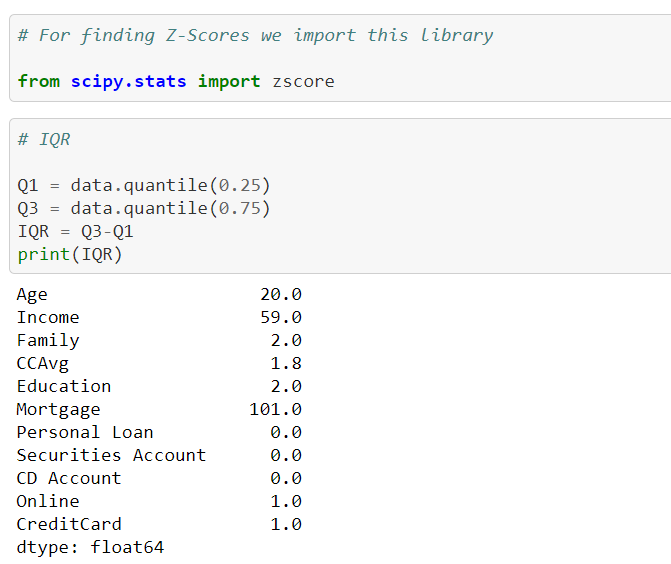
IQR ( InterQuartile Range ) :
It is equal to the difference between 75th percentile and 25th percentile or it is the difference between the upper quartile and lower quartile.
IQR = Q3 – Q1
IQR is a bit similar to Z-score in finding the distributions of the data in the dataset. You will get clarity from this below picture..
What to do after finding Outliers?
After finding Outliers in the data, we can correct them or we can remove them. We can perform any one from both of them.
We can manage outliers by
- Setting up filter in the testing tools.
- Remove or Change Outliers during post analysis.
- Managing Outlier values with the mean, median of the remaining values in the data.

The above code removed some rows i.e this code helps to remove the outliers in the dataset.
Conclusion :
Machine Learning is a vast topic to deal with. Outliers are the main problem in building Machine Learning model or Data Science model.
“ Every Outlier can be an Anomaly but every anomaly can not be an Outlier ”
Thanks for reading ???…!
Written By: Sai Harsha Tamada
Reviewed By: Vikas Bhardwaj
If you are Interested In Machine Learning You Can Check Machine Learning Internship Program
Also Check Other Technical And Non Technical Internship Programs