
In this article we will discuss the Text-Based Sentiment Detection App. This project addresses the problem of sentiment analysis in reviews given by amazon customers on their food products. This review has been classified according to the sentiment of This review expressed in them: positive, negative, or neutral. Nowadays everything is digital because of the covid-19 pandemic hence gone are those days.
when we used to visit shops to buy the product, now in one click we can get all the information about the company and their feedback given by existing customers. This is helpful for other customers who go to the product as well to know the quality of the product and quality of service in particular. Project code link is given in reference.
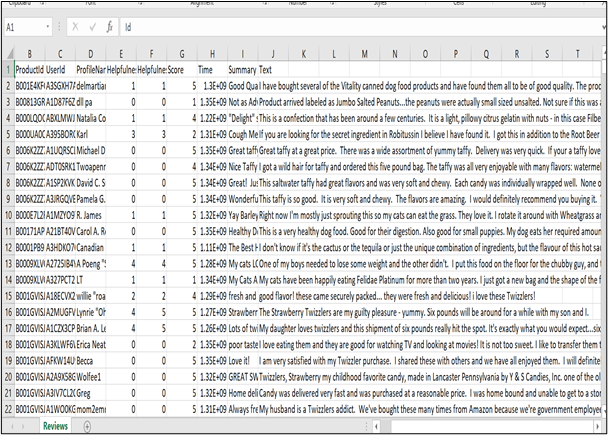
Above table showing the dataset which we have used in our project Amazon food reviews which consists of data around 568,454 food reviews Amazon users left up to October 2012. This dataset includes the product id and product profile name score and helpfulness, score, time, a summary of the text. In the whole table, our main focus was on the text data and score of customers.
Following method are being used in Sentiment Detection App:
1. Data Acquisition:
In our data, every review contains its Helpfulness Numerator, Profile Name, Use rid, Helpfulness Denominator, Time, Score, Summary (Text).
The summary(text) contains the actual review and scores contain rating values like 1,2,3,4,5. We will consider reviews with rating < 3 as Negative and reviews with rating equal =3 give as Neutral and reviews with ratings >3 as Positive.
2. Human labeling:
If we used the latter approach and here some of the reviews might behave noteworthy product review would be referring to some certain same type review and would thus have a somewhat similar type of the same kind mood or we can say nearby same type sentiment.
• Positive: If the complete review has a happy excited attitude or if something is mentioned with a positive view. Also, there are more positive words then it comes under the category. Ex: – I love the product. It’s amazing.
• Neutral: If the writer of the review expresses no personal sentiment/opinion in the review and merely transmits information. Expressions less or without any cheering such as neutral review. Ex: -product is ok.
• Negative: If the entire review has a negative, rude attitude or if something that word has negative emotion so that word will come under the negative sentiment. Ex: -product is not up to the mark, disappointed by product.
3. Tools and Metrics:
We have used a confusion matrix to evaluate the accuracy score of the model.
Data Cleaning:
It is one of the most tedious tasks. The model’s performance is directly proportional to how much clean your data. Here cleaning includes removing unnecessary elements, duplicate data, and handling missing data.
- Processing missing data and duplicates: For handling missing values, we can simply drop them, and when we don’t want to lose the information we use some imputation. techniques to fill these missing values. In our case we don’t have any of the missing values for content(text) and Rating (score), so we can go for the next step in which we drop the duplicates.
- Pre-Processing of text: In the reviews data we have a lot of unnecessary characters, some regular common words which are not going to add anything to the model’s performance. We need to eliminate such a character before modelling.
- Removal of all special characters and numbers using regression.
- Removal of all stop words.
- Conduct stemming using Porter Stemmer.
- Tokenize reviews and convert to lower case.
4. Feature Extraction:
Now that we have arrived at the position where we need to extract useful features from the stream of the line which can be used in the process of classification. And here we will discuss some text formatting techniques which are helping us in featuring the review and extracting it.
There following steps which we followed while featurization.
- Tokenization
- Handling missing data and duplicates
- Punctuation Removal
- Lowercase Conversion
- Stop-words removal
- EDA
Here we will understand our data first before we apply any modelling to it. It is always useful to analyze what our data is saying or trying to convey the sentiment and its mood. After pre-processing and removing all no useful, duplicates and missing values we were able to Extract 93% of actual data.

From the pie plot, we can clearly see that most dominant part class 1 constitutes almost 77% percent and next Class 0 is 15% and class 2 is 8% of the total area. Clearly, we can say that this is an imbalanced data show. This can be an issue for our model’s performance, we will address this issue during Modeling.
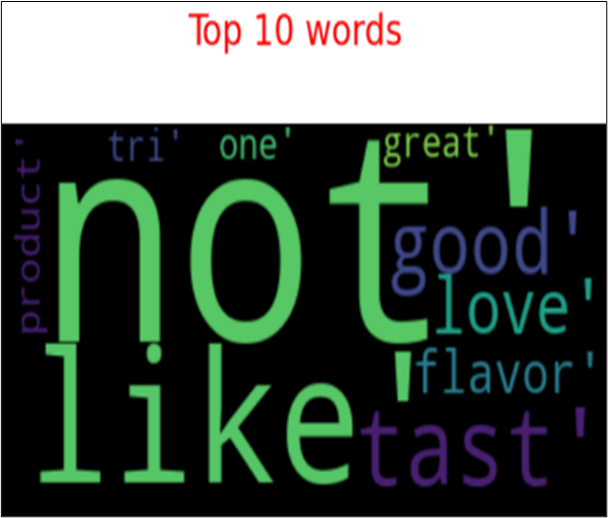
We found that the most used word in review are the following 10 words. From the word cloud top are great, good, love, flavours, taste, product, tri, one, like, not.
Tools
Hardware Requirement:
- i5 Processor Based Computer
- 1GB-Ram
- 5 GB Hard Disk
- Internet Connection
Software Requirement:
- Windows 7 or higher
- Notepad++
- Browser (Google Chrome)
- Jupyter notebook
Frontend :
- HTML5
- CSS3
Backend :
- Python
- Flask
Technique Used in Sentiment Detection App:
After cleaning the data now our data is ready to apply various algorithms. A very important step is modeling. First started with a simple base model, Logistic regression for that we used a sklearn python library. After applying Logistic regression with defaults parameters, we got an f1_score of 82%, Let’s see Its confusion matrix
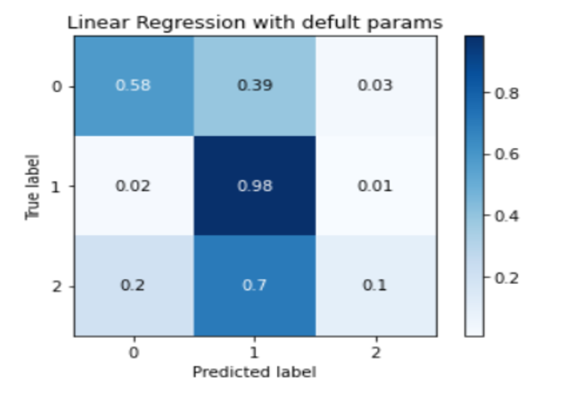
Here we observed that even though our class has f1_score good which is 82%, but when we noticed class-wise accuracy from the confusion matrix we can observe that our model was performing very poorly because of one reason “Data set is imbalanced”.In Solving this problem we used Logistic regression with hypermeter tuning So we got an f_1 score of 89. Class wise accuracy was better than simple logistic regression. We have used python language in the backend. There are some dependencies which we used in Sklearn, Pandas, beautiful soap and flask.
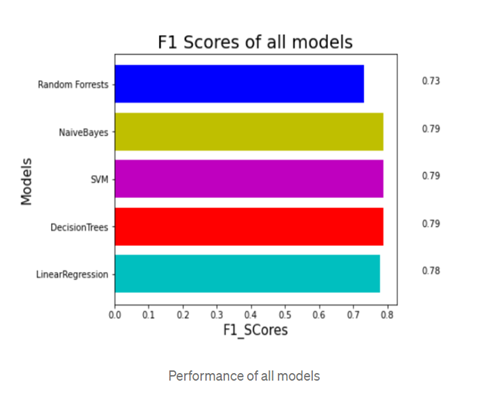
- F1 scores are an important measure which measures the accuracy of the model. We calculated it with the help of the precision and accuracy of the test. The highest possible value of 1 is one and represents the recall and the lowest possible value is 0.
- In the above, we have compared the accuracy of all the models and found out f 1_score of the model as we could see that accuracy of random forests 0.73, for naïve Bayes, 0.79 and SVM is 0.79 for decision tree it is 0.79, linear regression is 0.78.
- Considering all scores of class 0 of confusion matrix and class 1 of confusion matrix, class 2 of the confusion matrix our support Vector model is working efficiently and fast giving a proper accuracy score taking less time. On the other hand, simultaneously the decision tree is also working better.
Output:
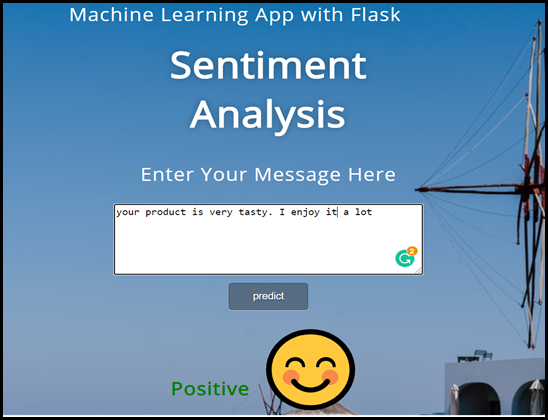
- This is a Front-end display of sentimental analysis that shows feedback in the form of different emoji.
- (e.g.- ?, ?, ?) as per the feedback or reviews are entered by a responder for product, food, etc.
- On the basis of this positive feedback we could consider that our customer is happy with the service we offered them.
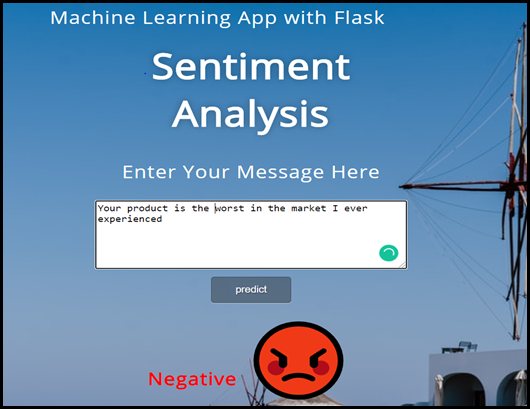
- The sentimental analysis displays an output as a Angry emote for bad or a negative feedback entered by a responder.(e.g. – your product is worst in the market, I ever experienced / output – ?)
- On the basis of this Negative feedback we could consider that the customer is unhappy with the service we offered them and we need to focus on improving the service.
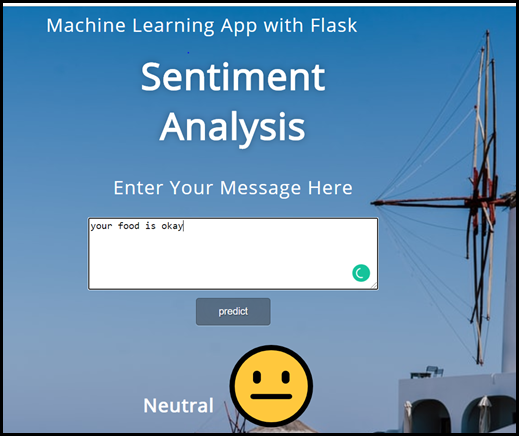
- The sentimental analysis displays an output as a Neutral emote for normal feedback entered by a responder. (e.g. – your food is okay / output -?)
- This shows that there is room for improvement on the service of food or product.
Conclusion
We are able to predict the sentiment of the customer with an accuracy of 79%, We Observed our model’s performance is limited as we used 40k reviews out of a total of 596k because, in case of more data our model will take more time to execute, for faster execution we need more computational power so that we could try with total data set, Total data means have more words which could improve the performance of our model.
Reference:
https://github.com/Triveni-prog104/Text_Based_sentiment_detection
Written By: Triveni Kohale
Reviewed By: Vikas Bhardwaj
If you are Interested In Machine Learning You Can Check Machine Learning Internship Program
Also Check Other Technical And Non Technical Internship Programs